Free on the App Store
BoostT1D for iPhone
Plenty of apps will store your numbers. BoostT1D reads the CGM setup you already have and helps you make sense of them, what your week actually did, what your meals looked like, and what to ask your care team next time. Built by a teen living with Type 1, for everyone living with it.

Requires iOS 18 or later. No account needed.
Your data, wherever it lives
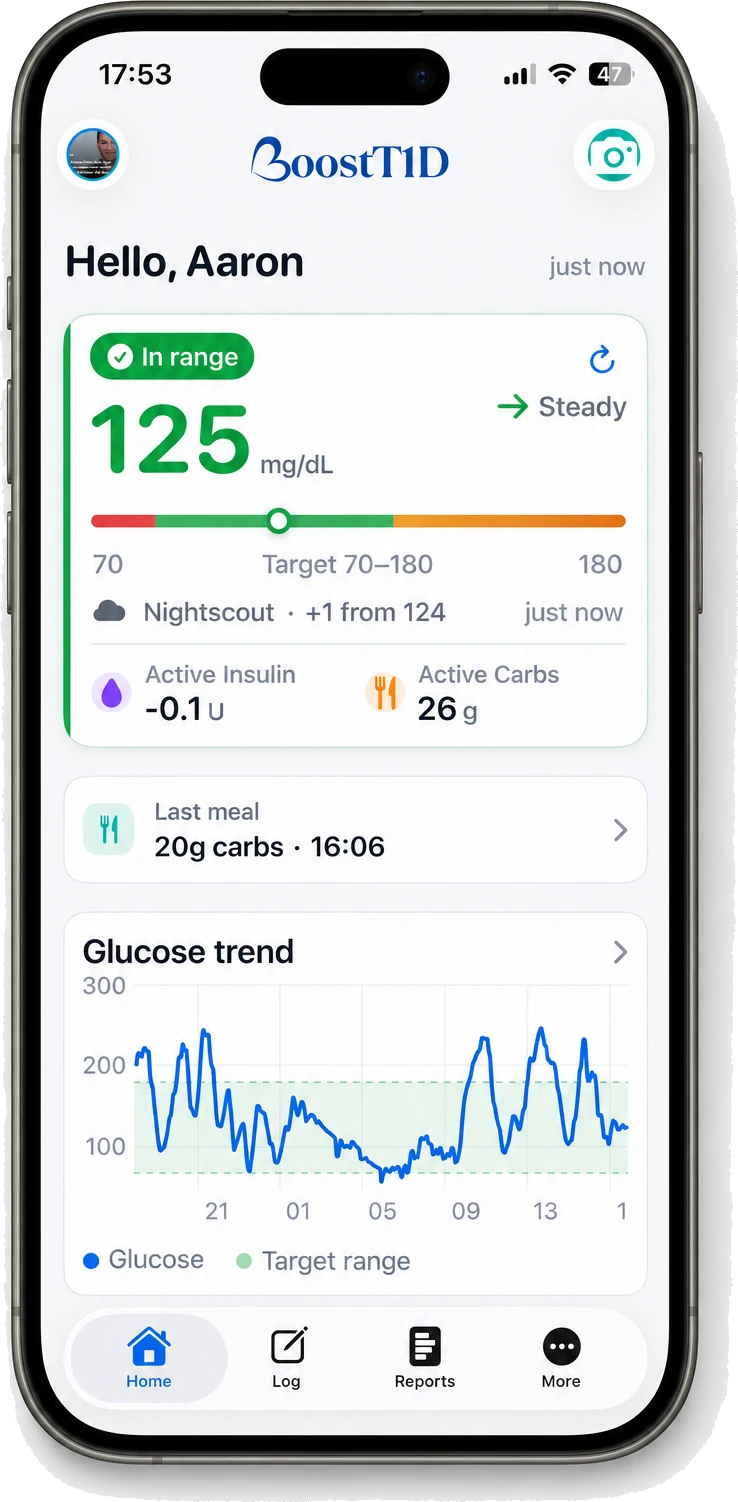
Connects to the CGM setup you already have
Bring in readings from Nightscout, Dexcom Share, or LibreLinkUp, no new hardware, no switching systems. If you run an automated loop such as Trio, Loop, or AndroidAPS, BoostT1D reads that too and understands which insulin your algorithm delivered rather than treating it as decisions you made.
- Nightscout, Dexcom Share, and LibreLinkUp supported
- Works alongside any Nightscout-connected loop
- Readings cached on device so the app still works offline
Meals
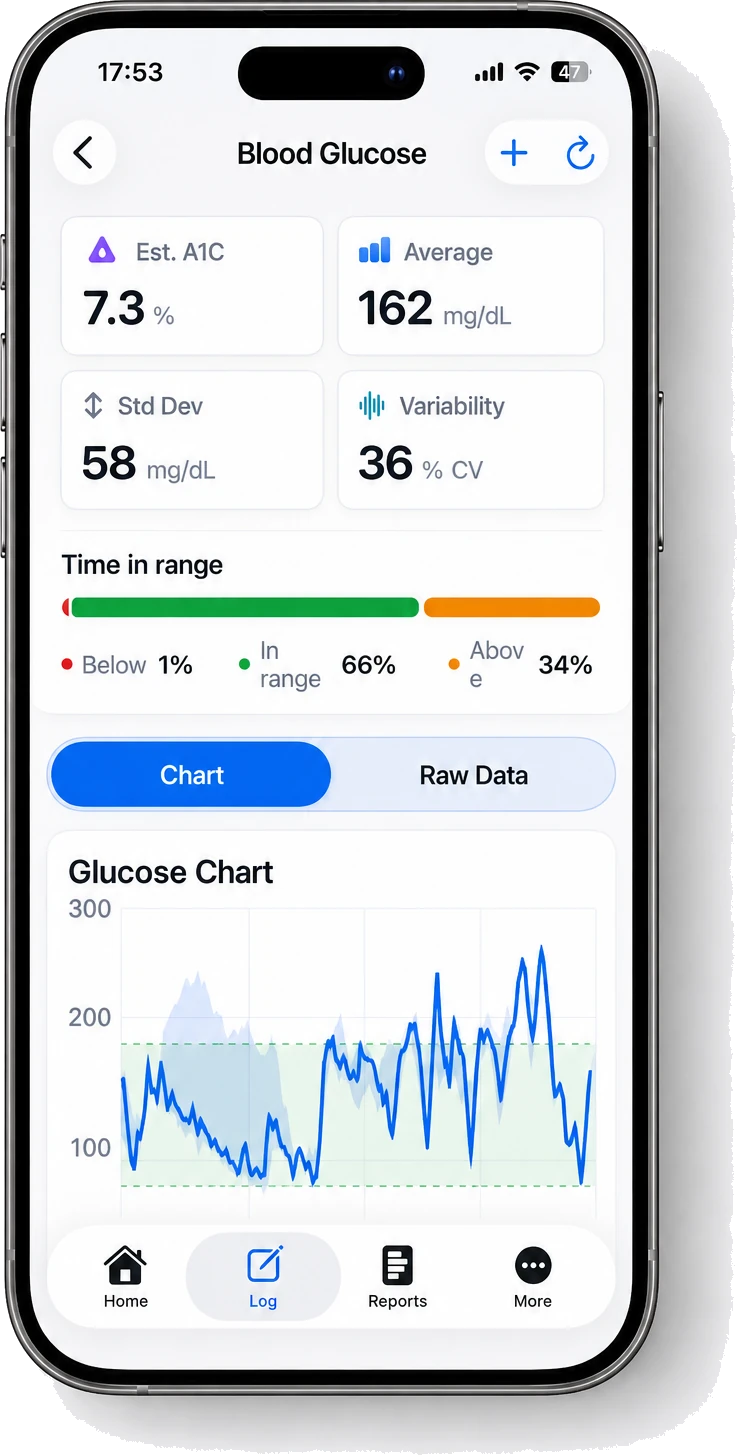
Estimate carbs from a photo
Take a picture of your plate and get a carb estimate with the reasoning behind it, plus protein, fat and fibre. Adjust anything that looks off before you save it, the estimate is a starting point, not the last word.
- Carbs, protein, fat and fibre
- Every value editable before saving
- Saves to your food log with what you actually ate
Patterns
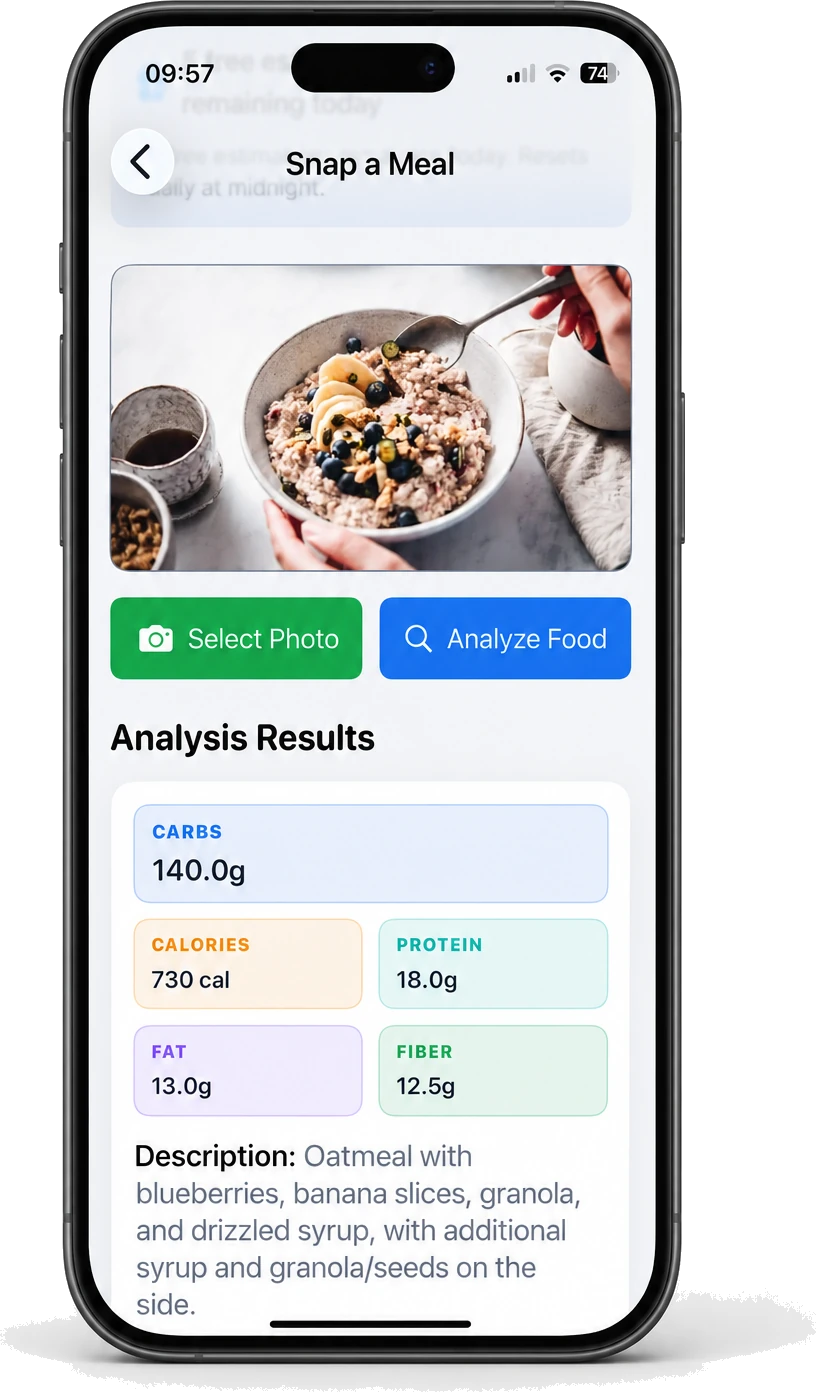
See the pattern, not just the number
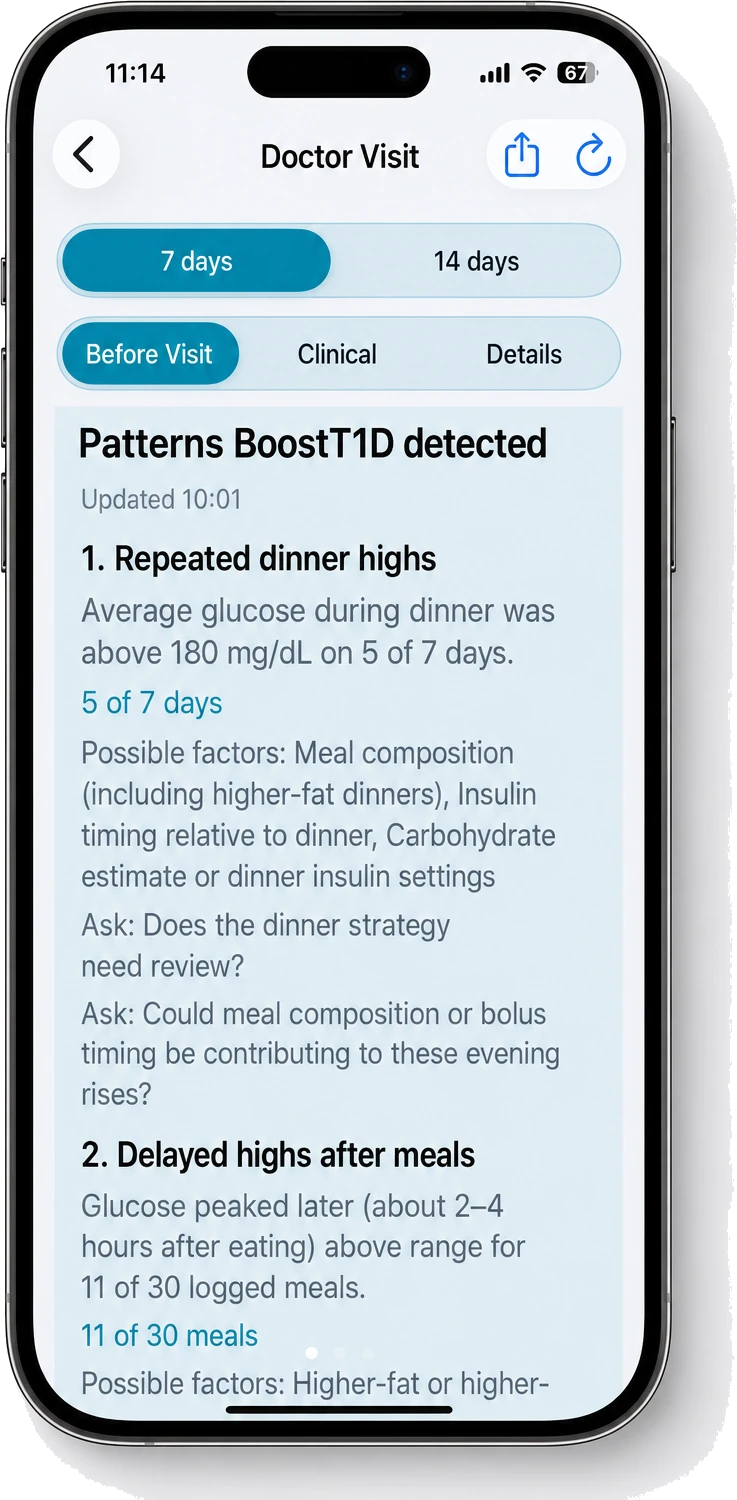
BoostT1D looks across your last few days for things worth noticing, overnight lows, a time of day that consistently runs high, variability that's creeping up, and explains what it found in plain language, with the days it's based on.
- Recurring highs and lows by time of day
- How often each pattern actually occurred
- Written for a conversation, not a dashboard
Appointments
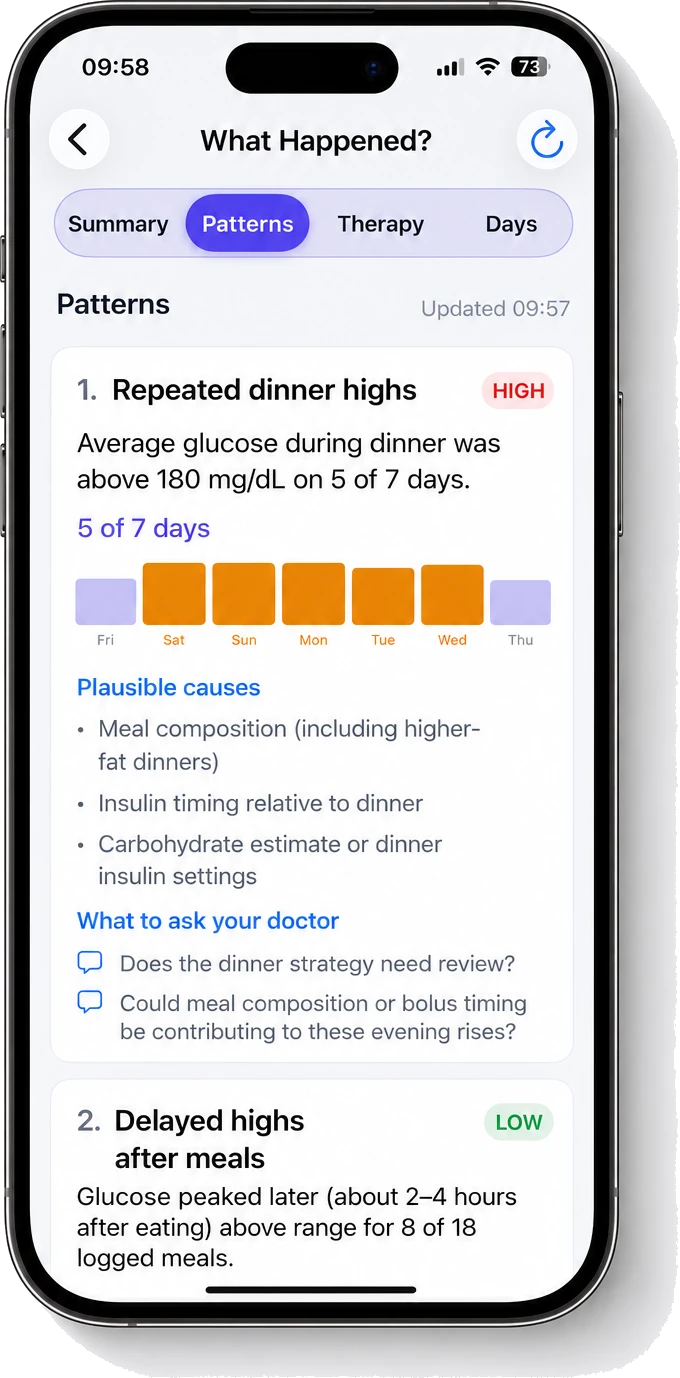
Walk into your visit prepared
Turn weeks of data into a report you can hand over: what changed since last time, the patterns that stood out, your therapy settings, day-by-day detail, and space for the questions you want answered. Export it as a PDF and email it ahead.
- Ambulatory glucose profile and time in range
- Day-by-day insulin and carb detail
- Your own questions, saved between visits
- Shareable PDF
What BoostT1D is not
BoostT1D is not a medical device and does not provide medical advice, diagnosis, or treatment recommendations. It does not tell you how much insulin to take. It helps you see your own data clearly and bring better questions to the people who do advise you. Always consult your healthcare provider before making any changes to your care.
Read the full disclaimer, privacy policy and terms.
There’s more to this than data
BoostT1D also connects people living with Type 1, buddies who get it, volunteers who show up, and resources for anyone newly diagnosed. That part lives here on the web.