User Manual — Your Type 1 Diabetes Companion
User Manual — Your Type 1 Diabetes Companion
Chapter 1
BoostT1D is an educational companion app for people living with Type 1 diabetes. It brings glucose readings, meal logs, and insulin/carb events into one place, and turns that data into plain-language summaries you can use for your own awareness and to bring to your care team.
Chapter 2
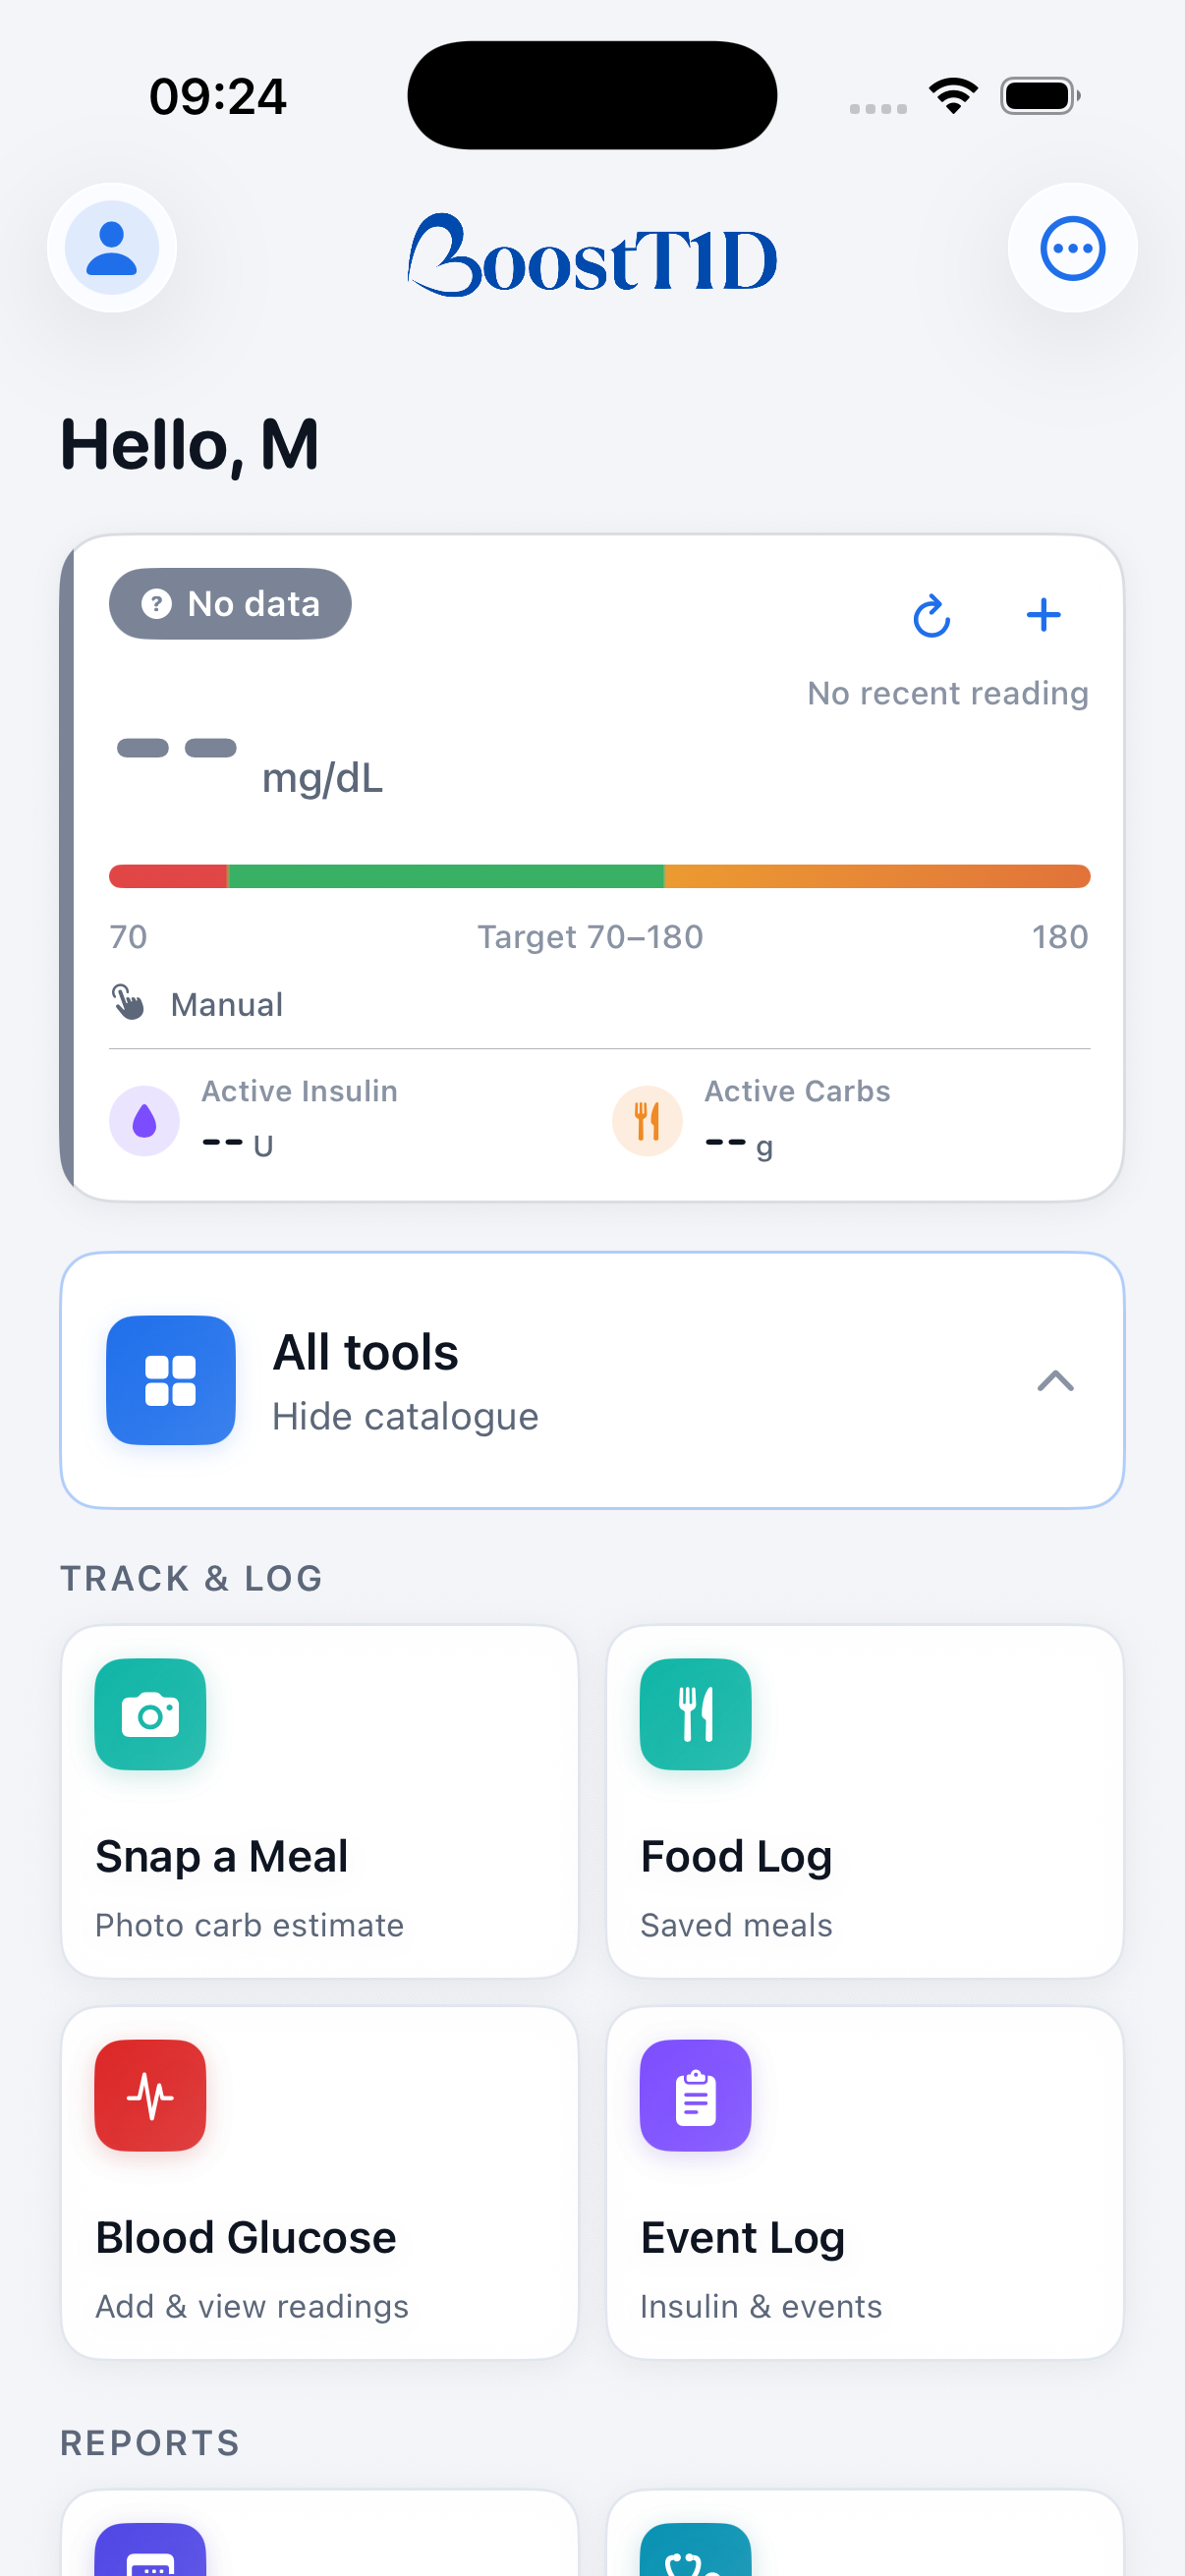
The Dashboard is the home screen. Its centerpiece is the glucose card: your latest reading with trend arrow, a status badge (Low / In Range / High, etc.), a low–target–high range track with a marker showing exactly where the reading sits, and a line for data source, change from the last reading, and how fresh the reading is. A refresh button re-syncs immediately; in manual-entry mode a + button next to it lets you add a reading on the spot. Below the divider, the same card shows your Active Insulin (IOB) and Active Carbs (COB) as read-only figures — tap the info icon next to them if they read "--" to see why (usually a stale or unsupported connection).
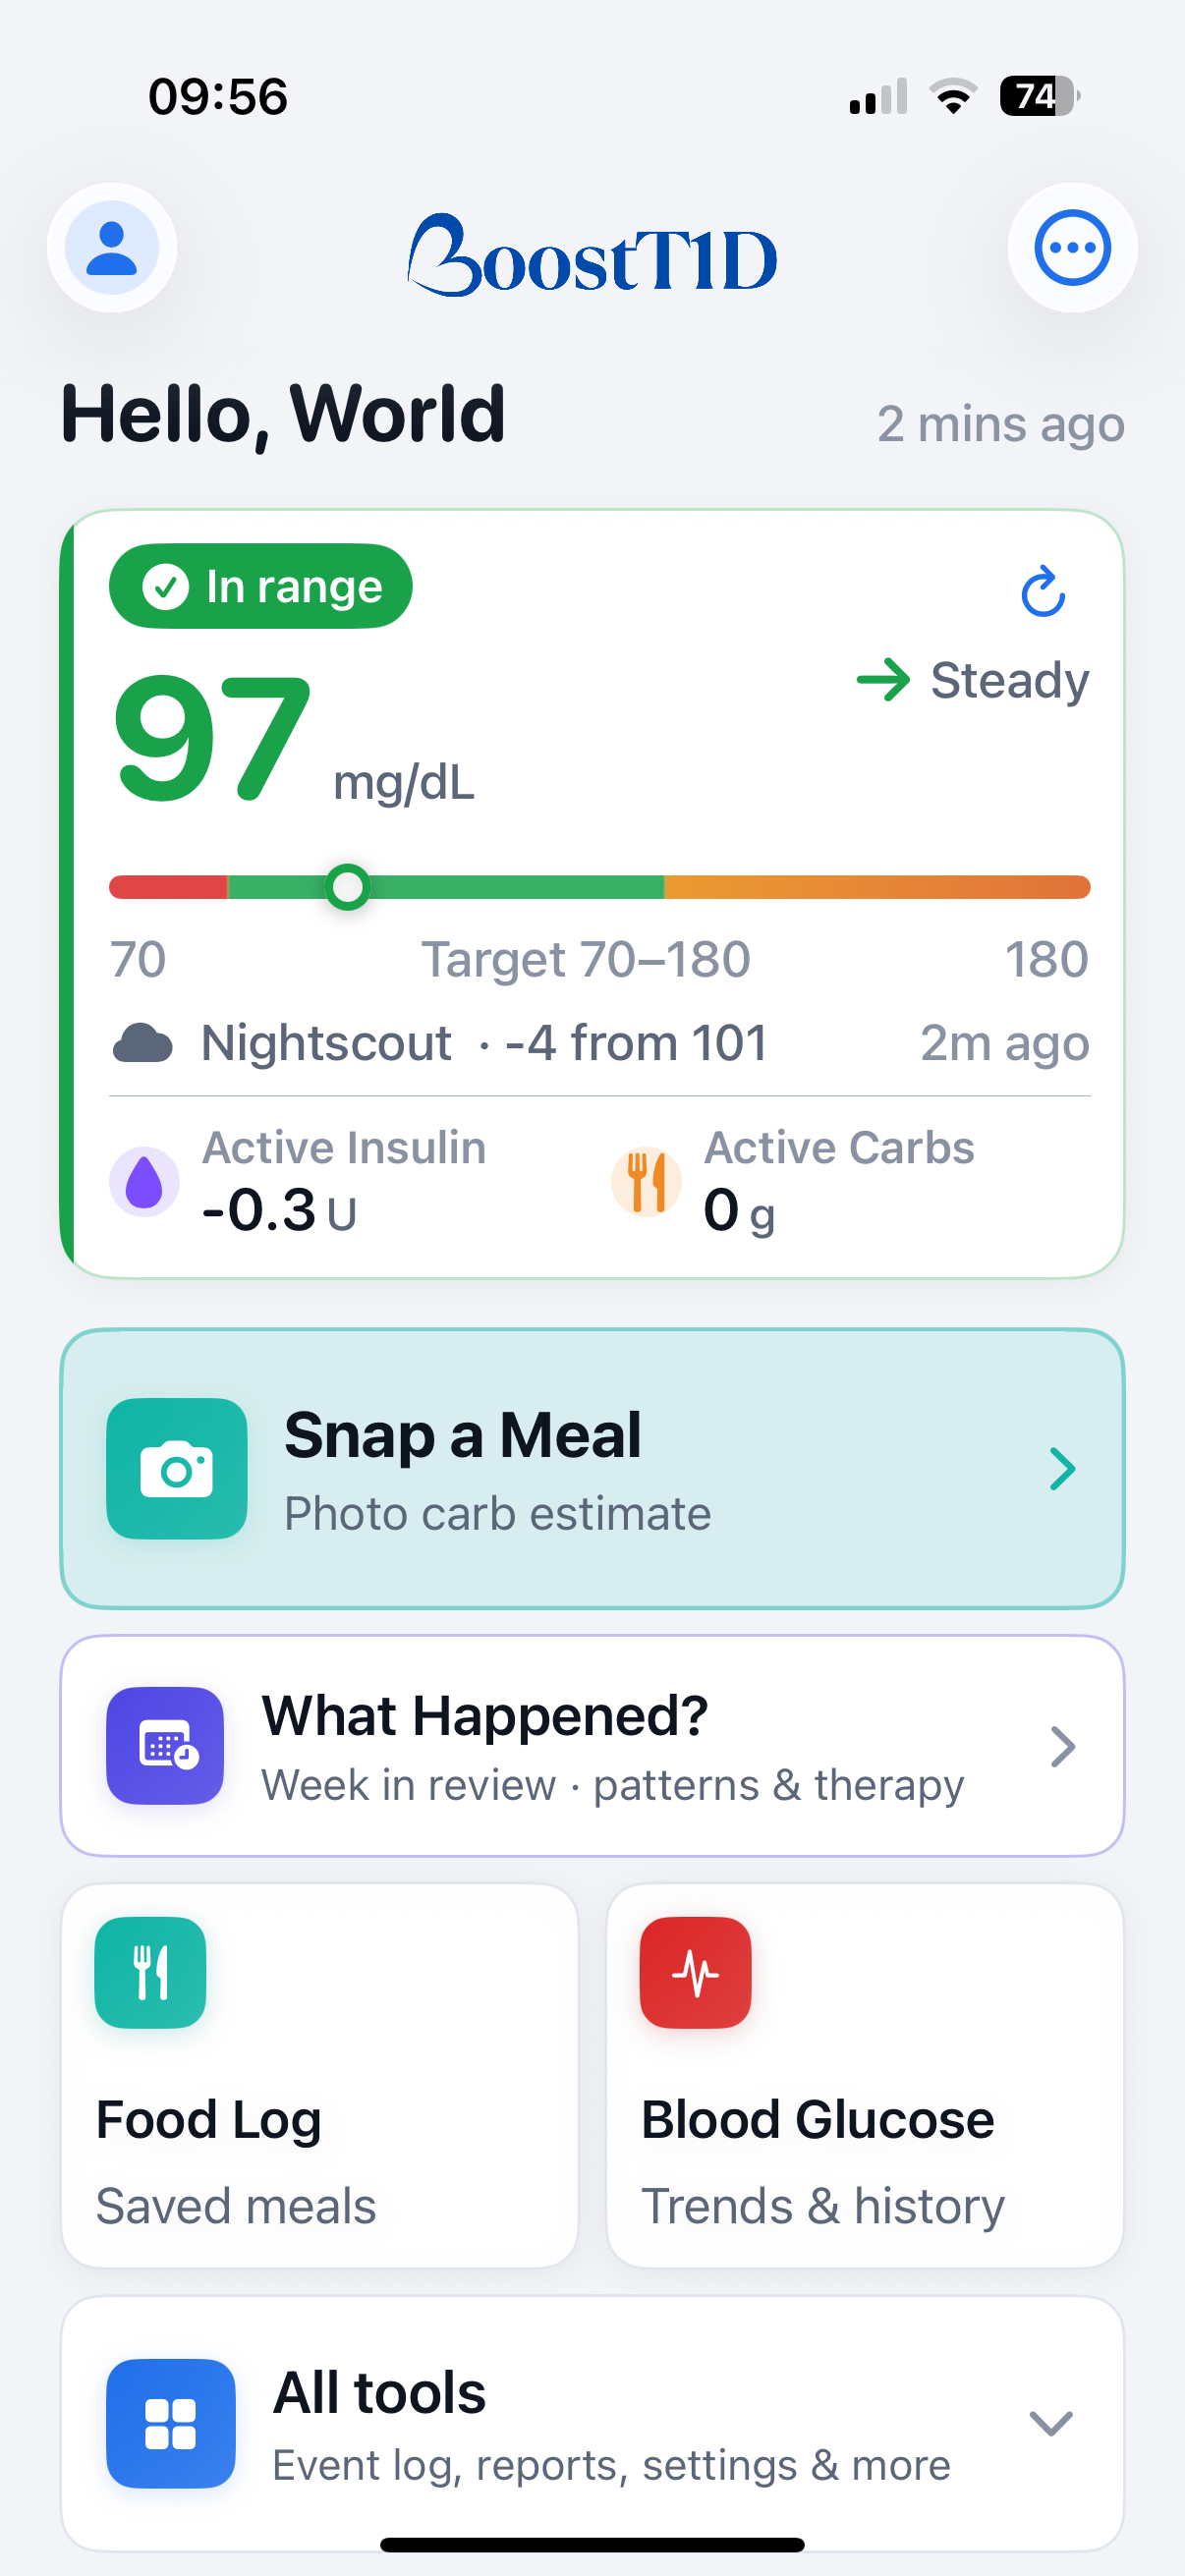
Below the glucose card, the Dashboard leads with two full-width buttons: Snap a Meal (photo carb estimate — used most often, so it comes first) and What Happened? (your week in review, including patterns and therapy). Underneath, a two-tile row gives one-tap access to Food Log and Blood Glucose.
An All tools row expands in place — tap it to reveal the full catalogue (Track & Log, Reports, Therapy & Settings, About) without leaving the Dashboard; tap again to collapse it.
The profile photo (top left) opens Settings. The ••• menu (top right) is a shortcut to every screen in the app, grouped the same way as the All Tools row, for when you'd rather not scroll.
Chapter 3
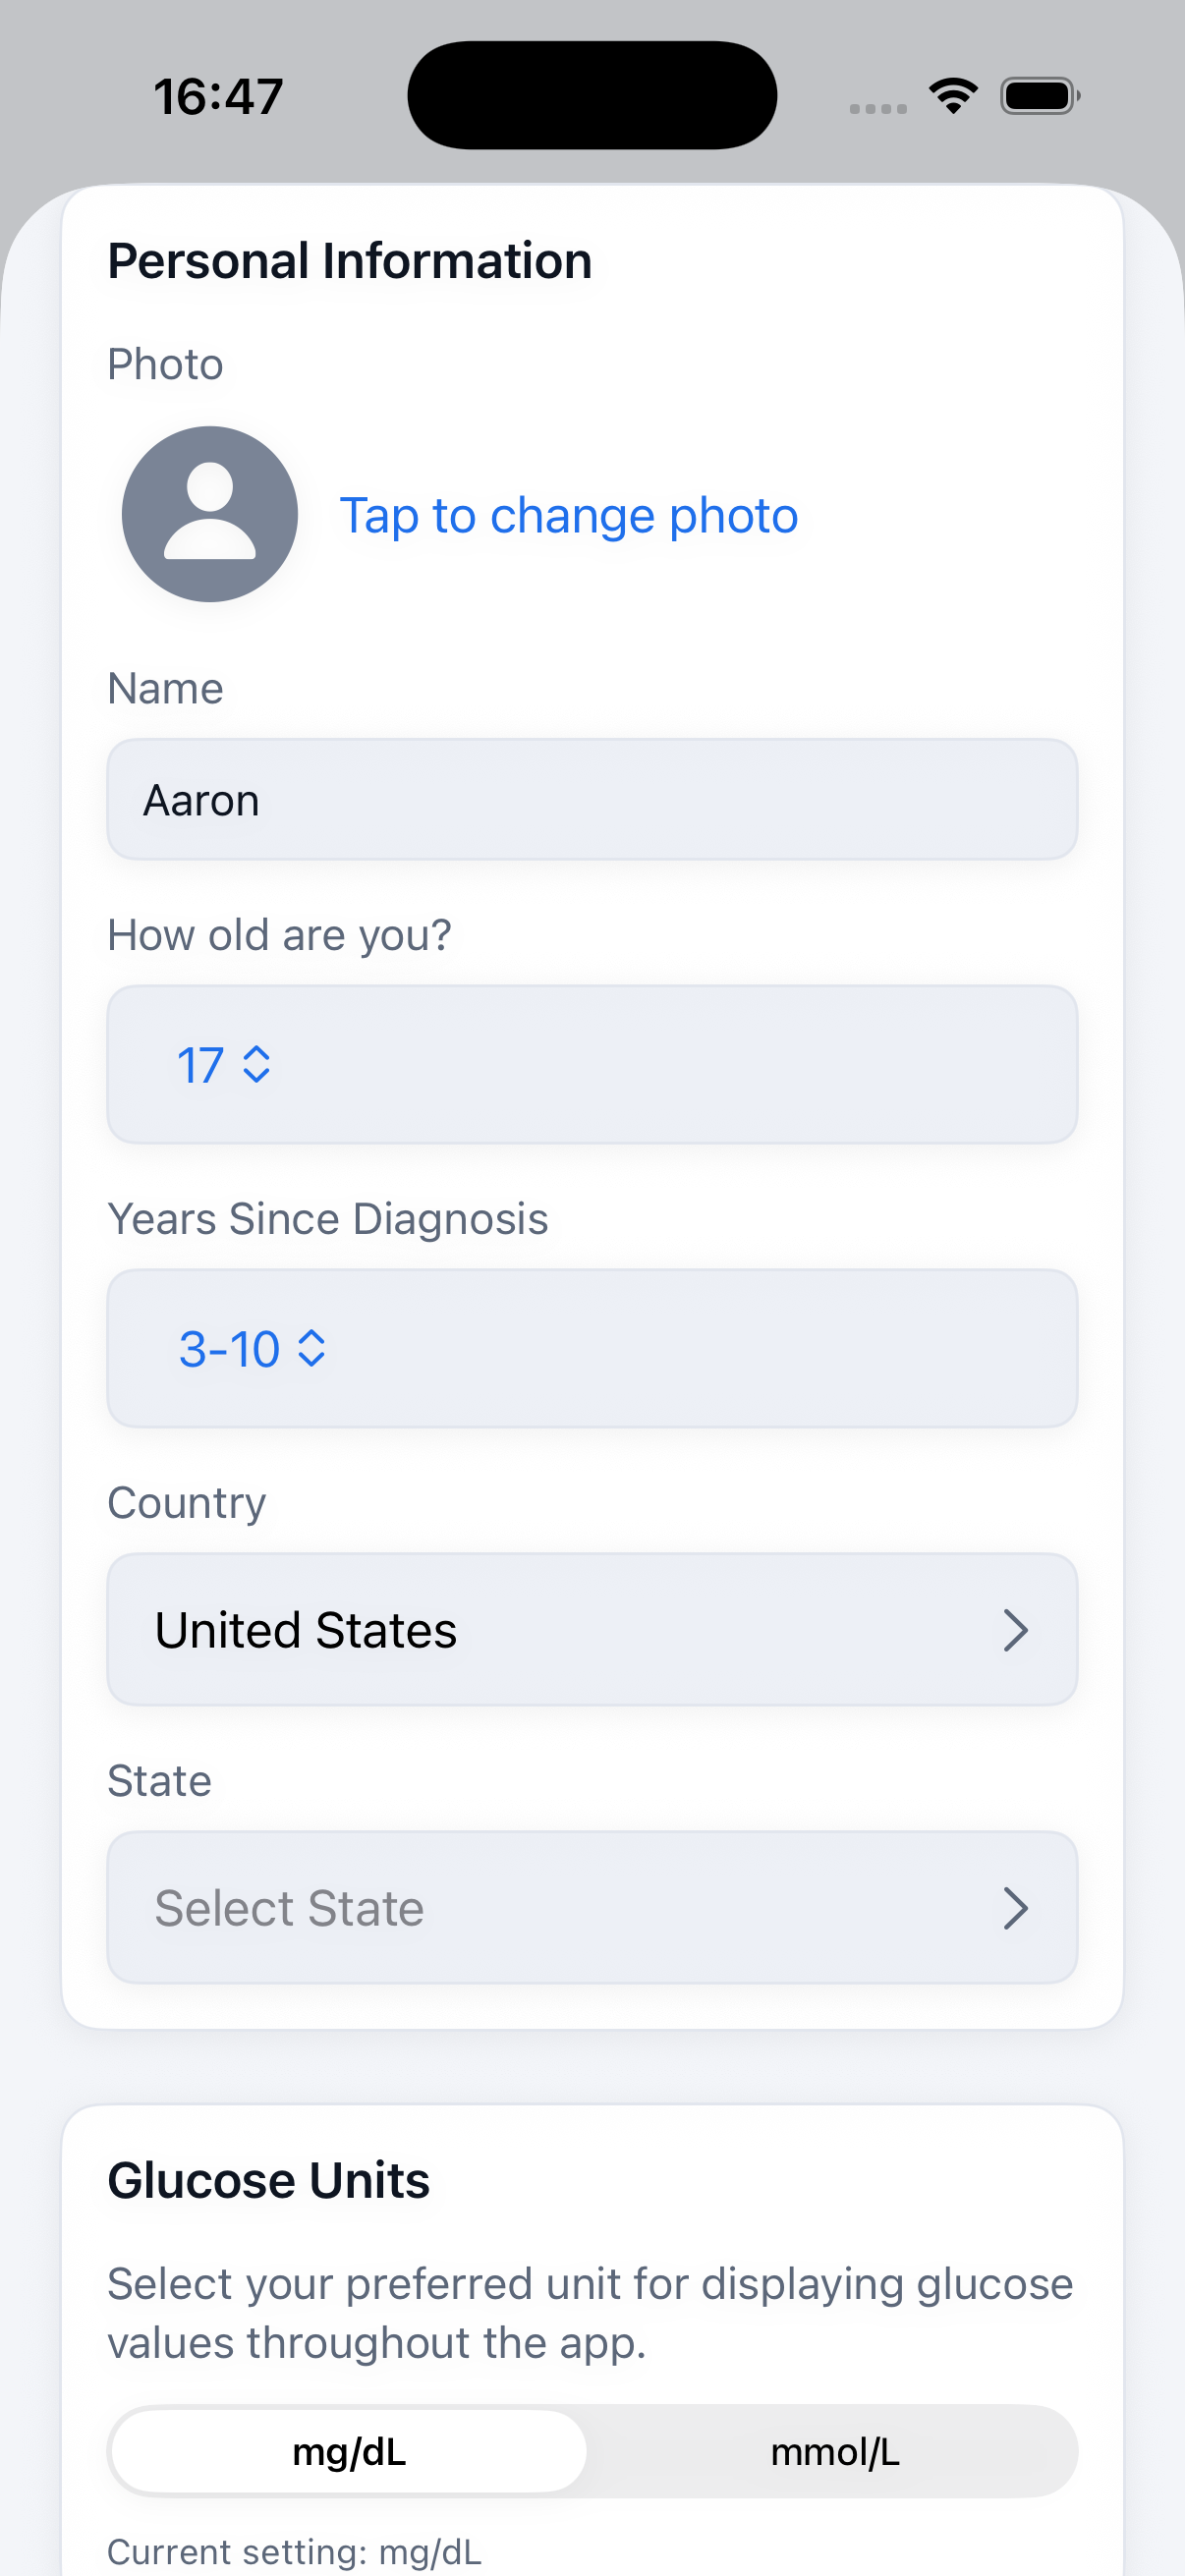
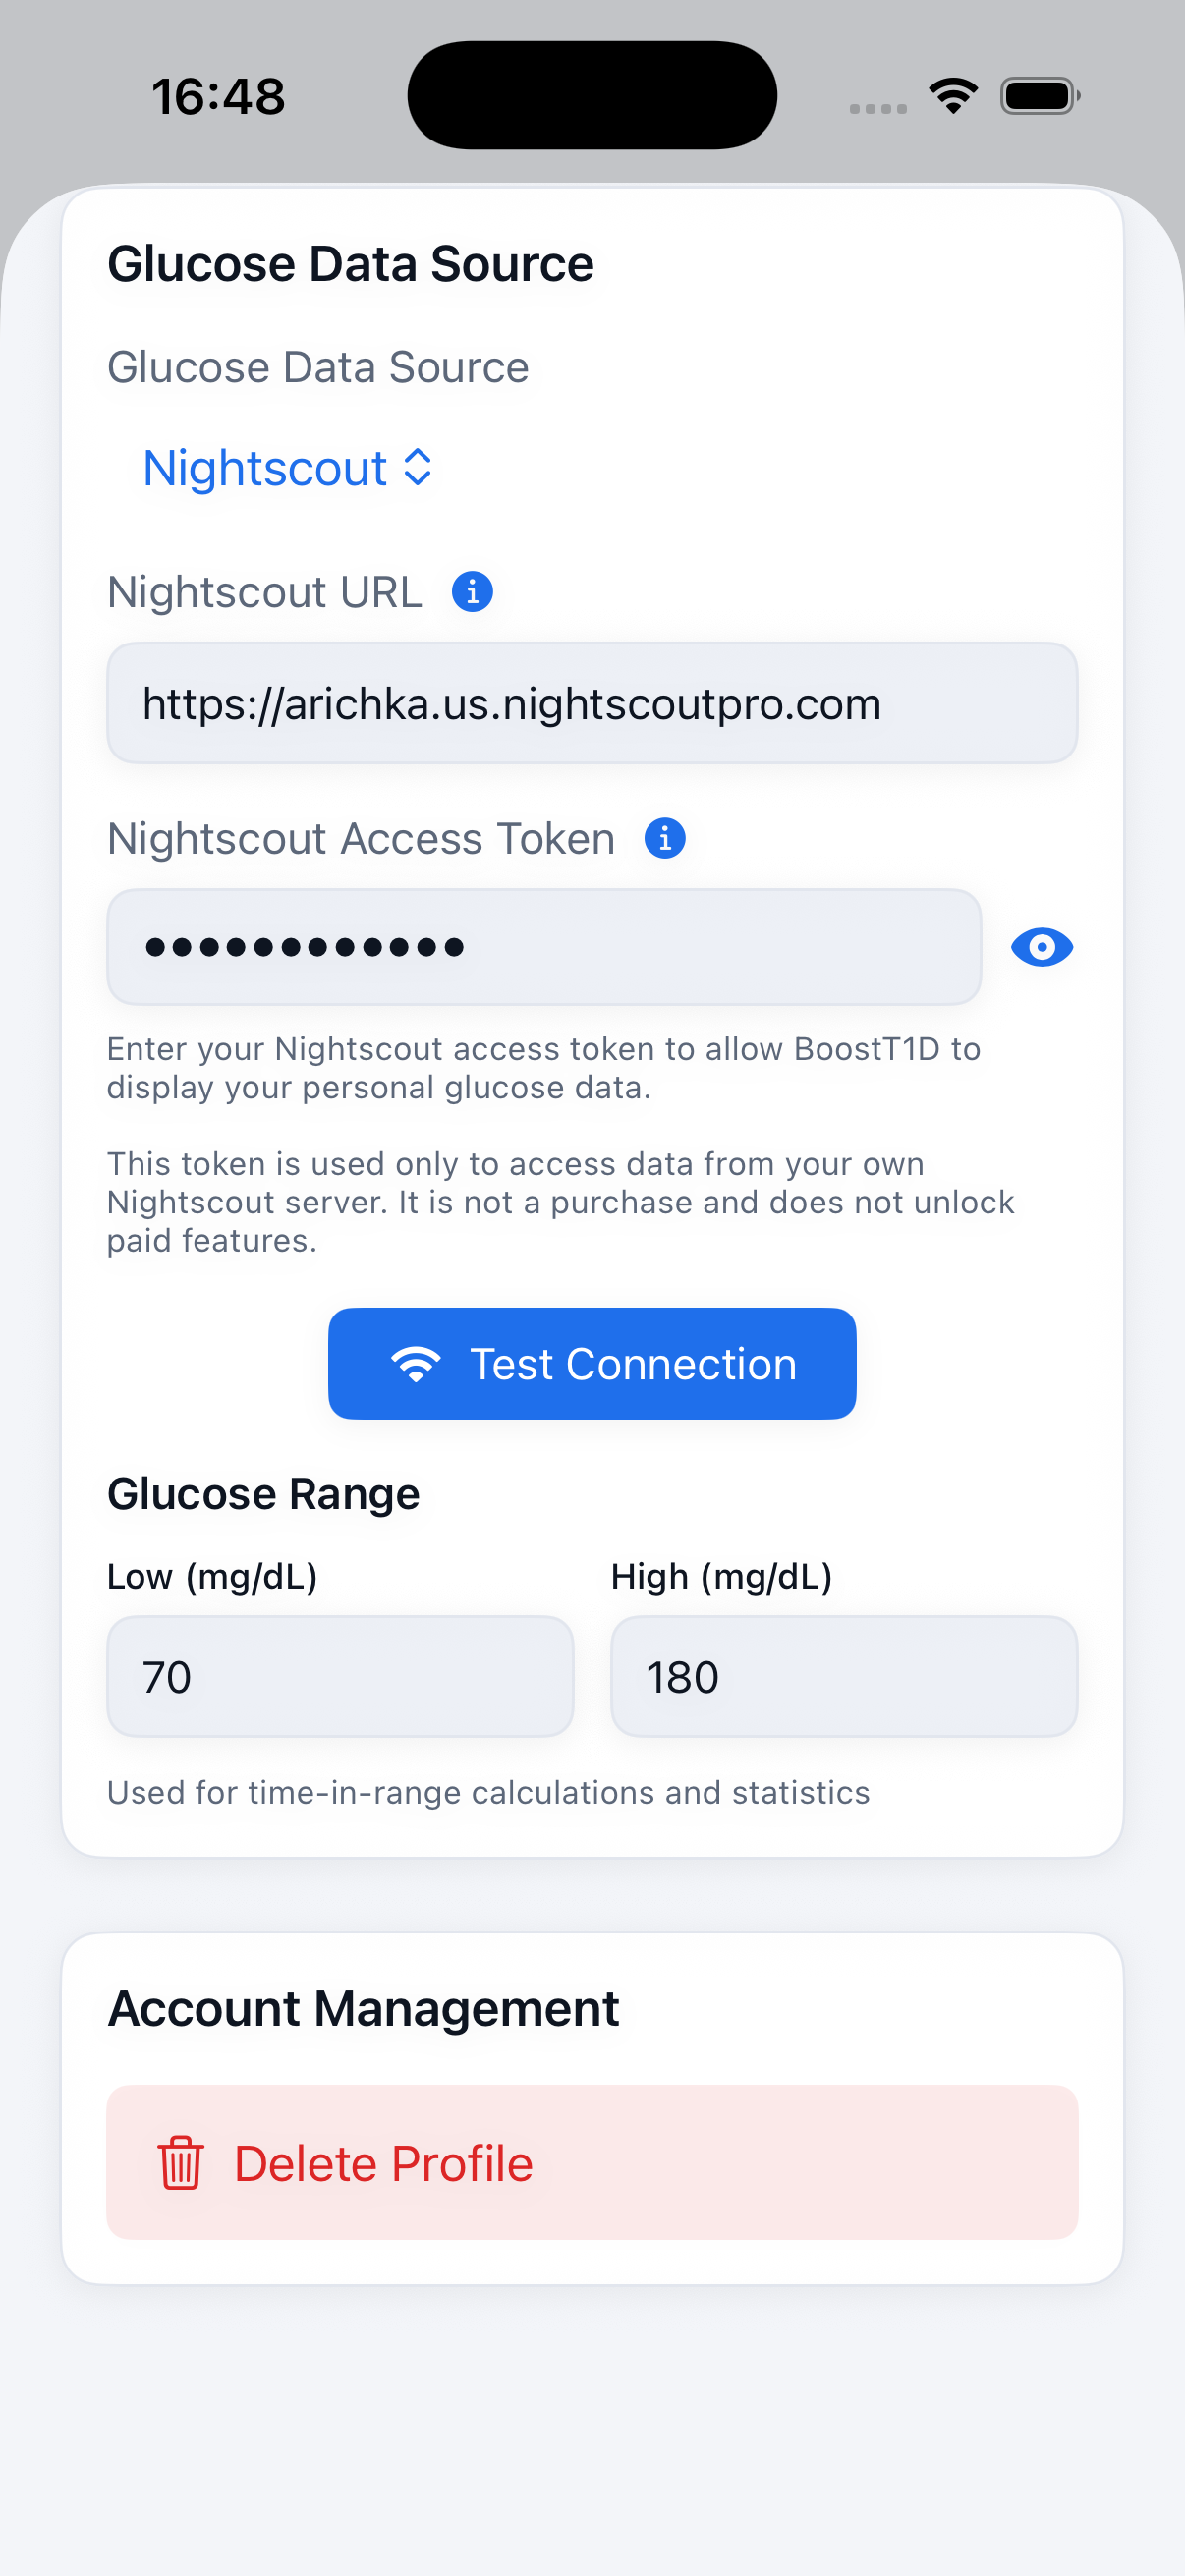
Tap the profile icon on the Dashboard (or Settings under All Tools) to edit your name, age, years since diagnosis, country/state, and preferred glucose units (mg/dL or mmol/L). Scrolling further down the same screen lets you choose and configure your glucose data source — Nightscout URL/token, Dexcom Share credentials, LibreLinkUp credentials, or manual entry — and set your low/high glucose range used for time-in-range calculations.
A Reports section further down holds one switch, Advanced details. It's off by default so the What Happened report speaks plain English; turn it on to also see clinical setting names, how many days of data each finding is based on, and the full calculation behind it. Nothing safety-relevant — caveats, delivery notes, the care-team disclaimer — is ever hidden behind this switch either way.
Chapter 4
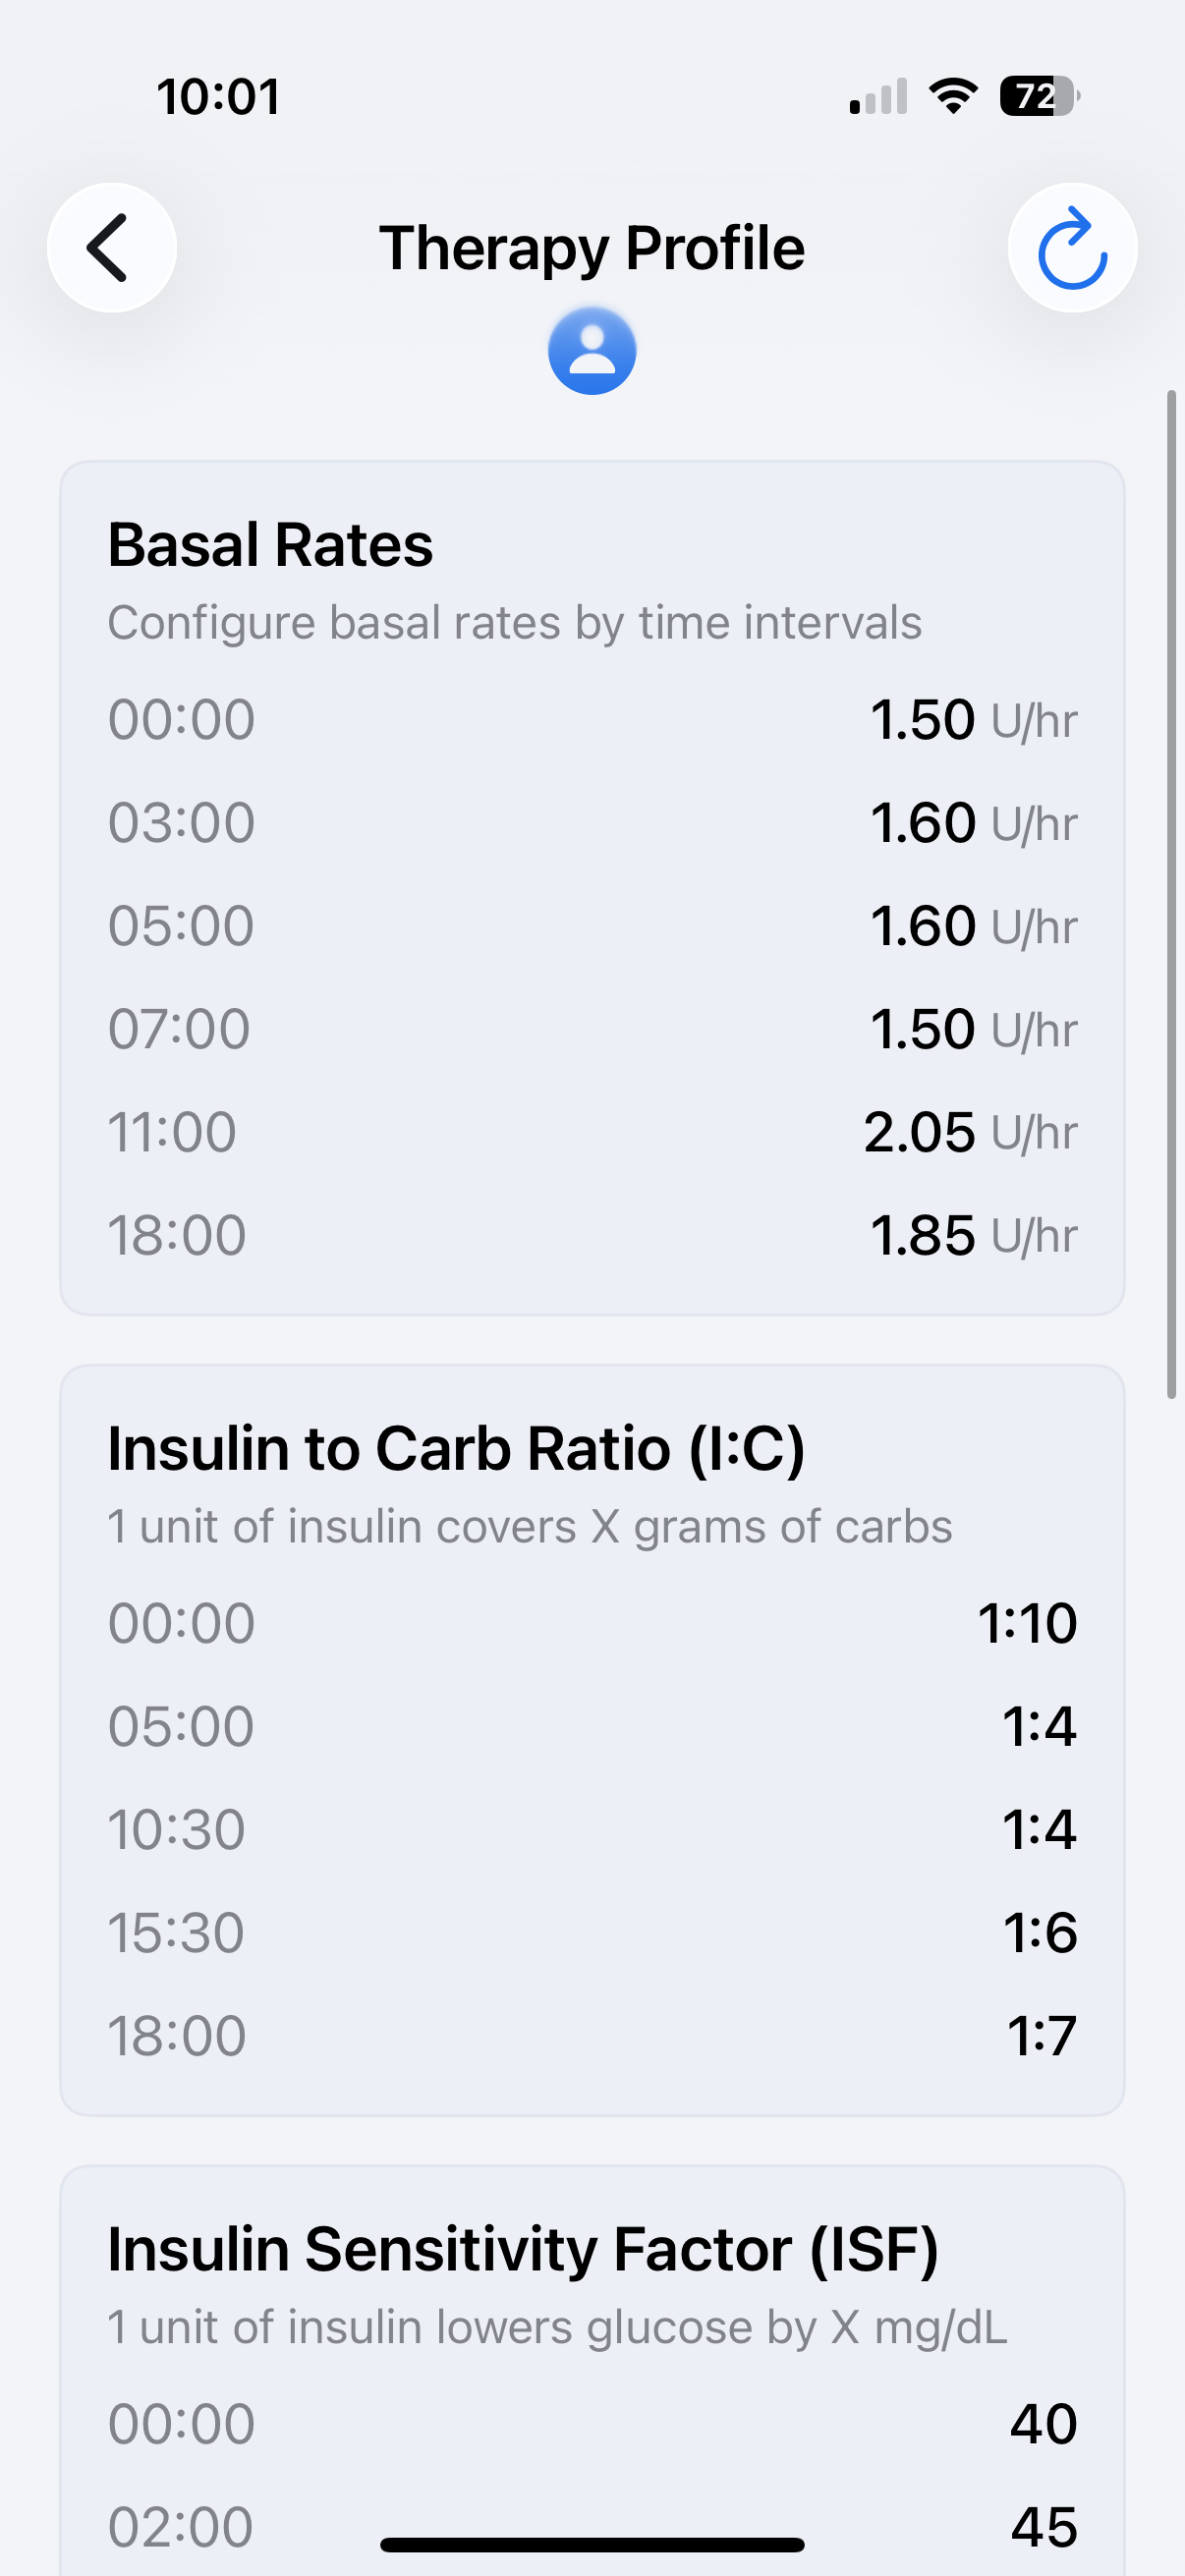
Found under All Tools → Therapy Profile. Here you enter your basal rates, insulin-to-carb ratios (I:C), and insulin sensitivity factor (ISF), each configurable across multiple time-of-day intervals. These values feed the educational bolus calculator and the therapy review on What Happened → Therapy — enter them exactly as prescribed by your care team.
Chapter 5
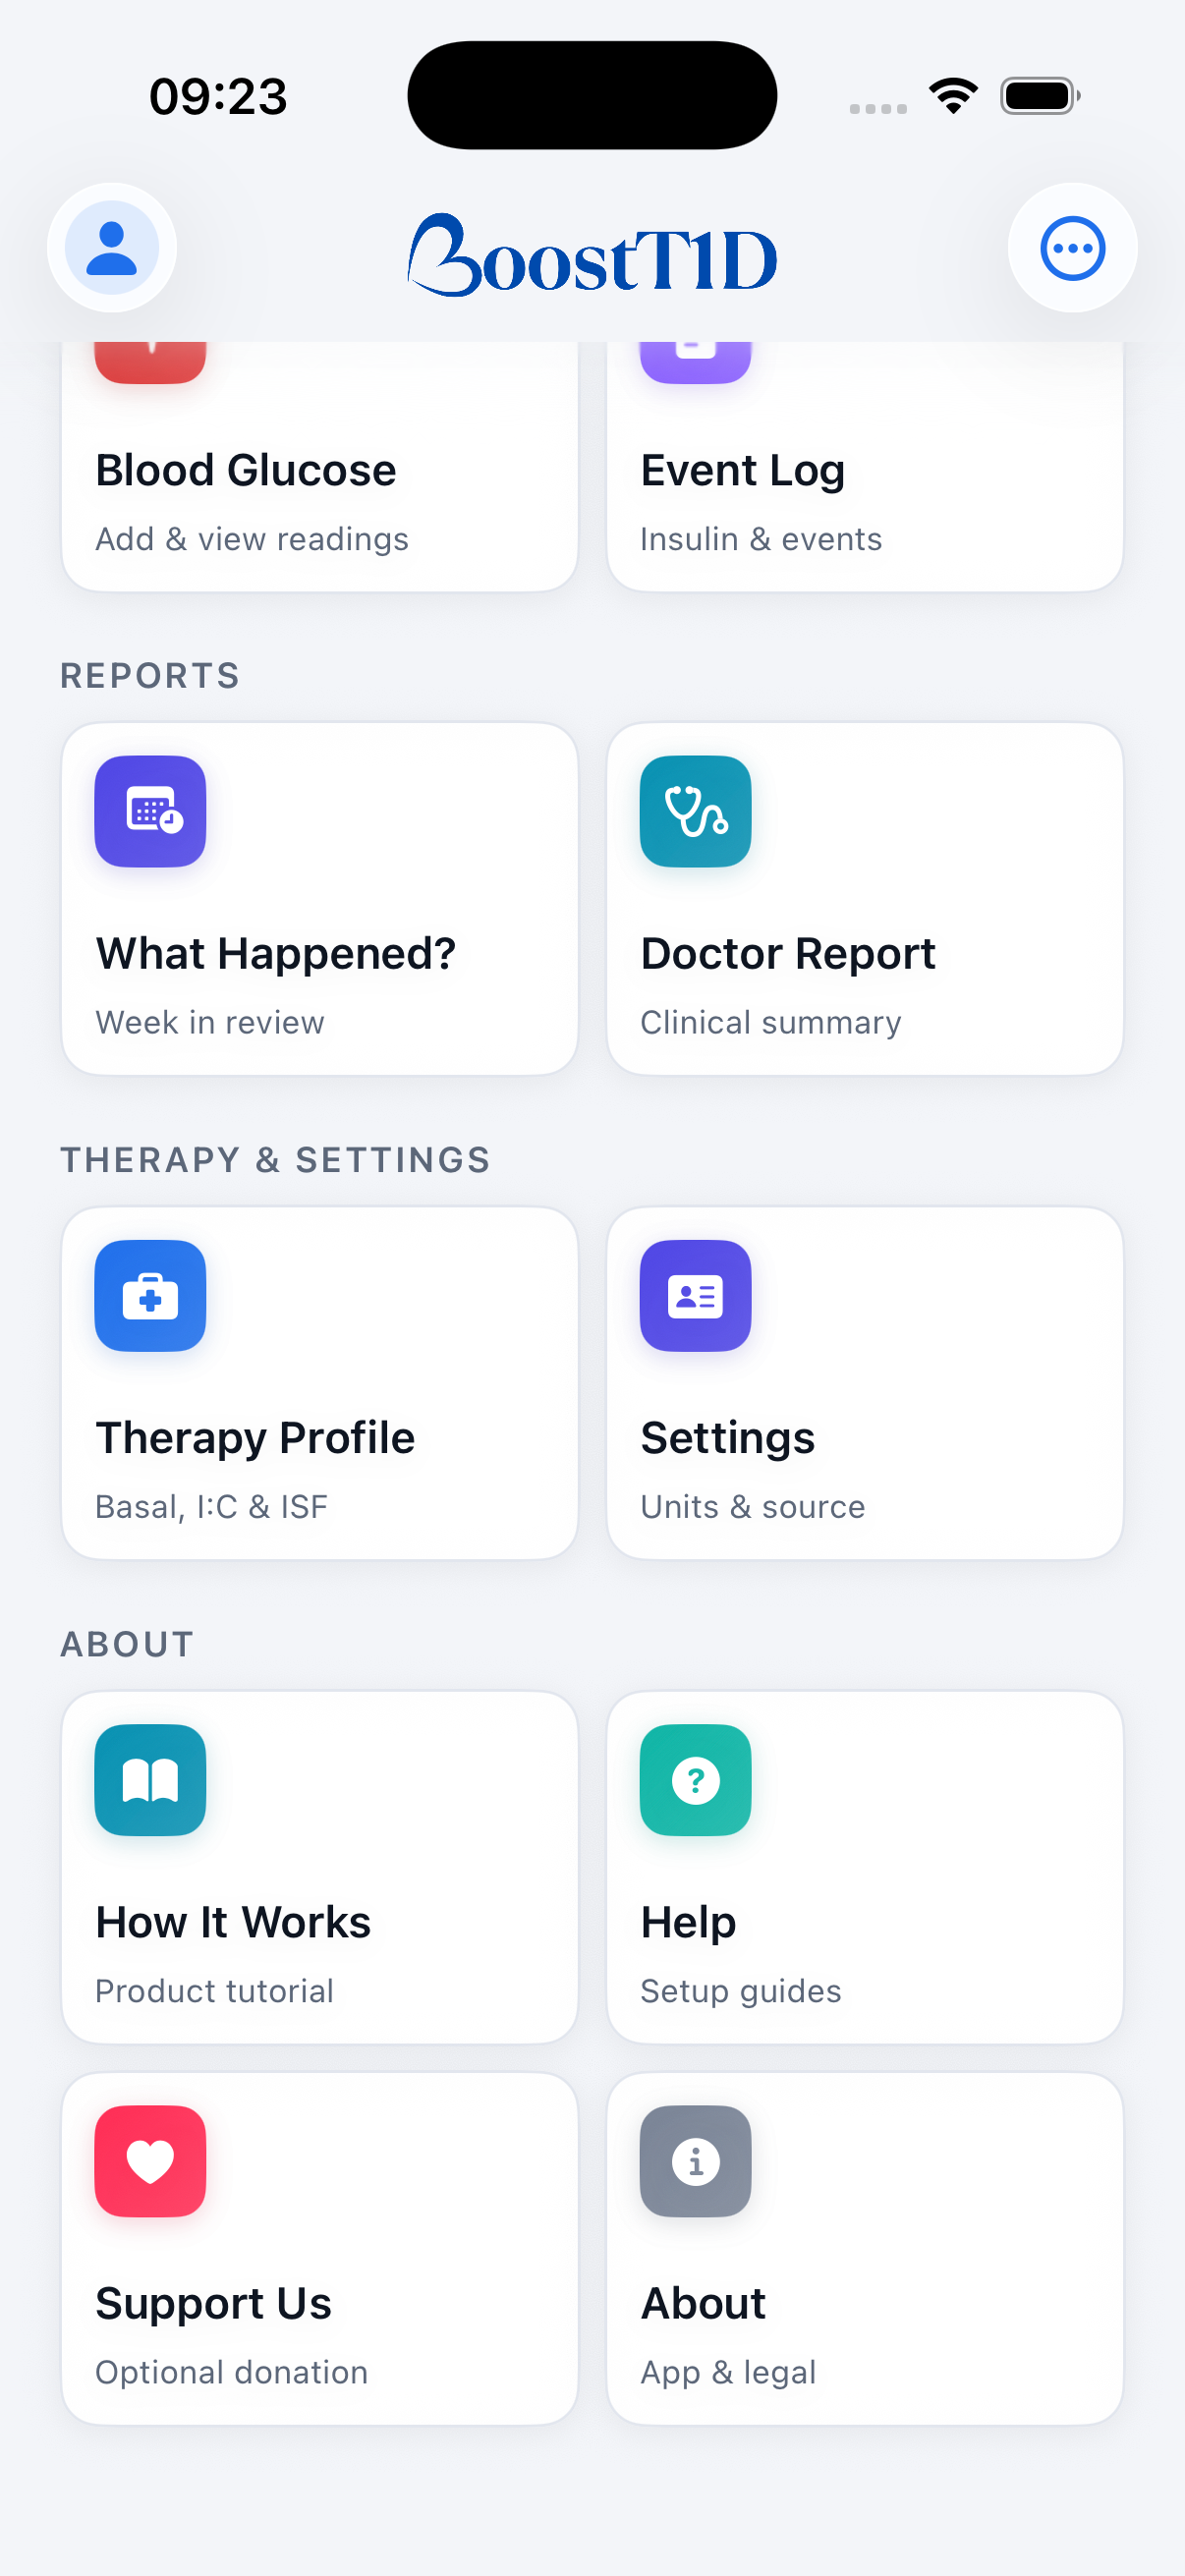
Every screen not on the Dashboard's quick-action row lives in one catalogue, reachable two ways: expand the All tools row on the Dashboard itself, or tap the ••• menu in the top-right corner from anywhere. Both list the same four groups — Track & Log (Snap a Meal, Food Log, Blood Glucose, Event Log), Reports (What Happened?, Doctor Report), Therapy & Settings (Therapy Profile, Settings), and About (How It Works, Help, Support Us, About).
Chapter 6
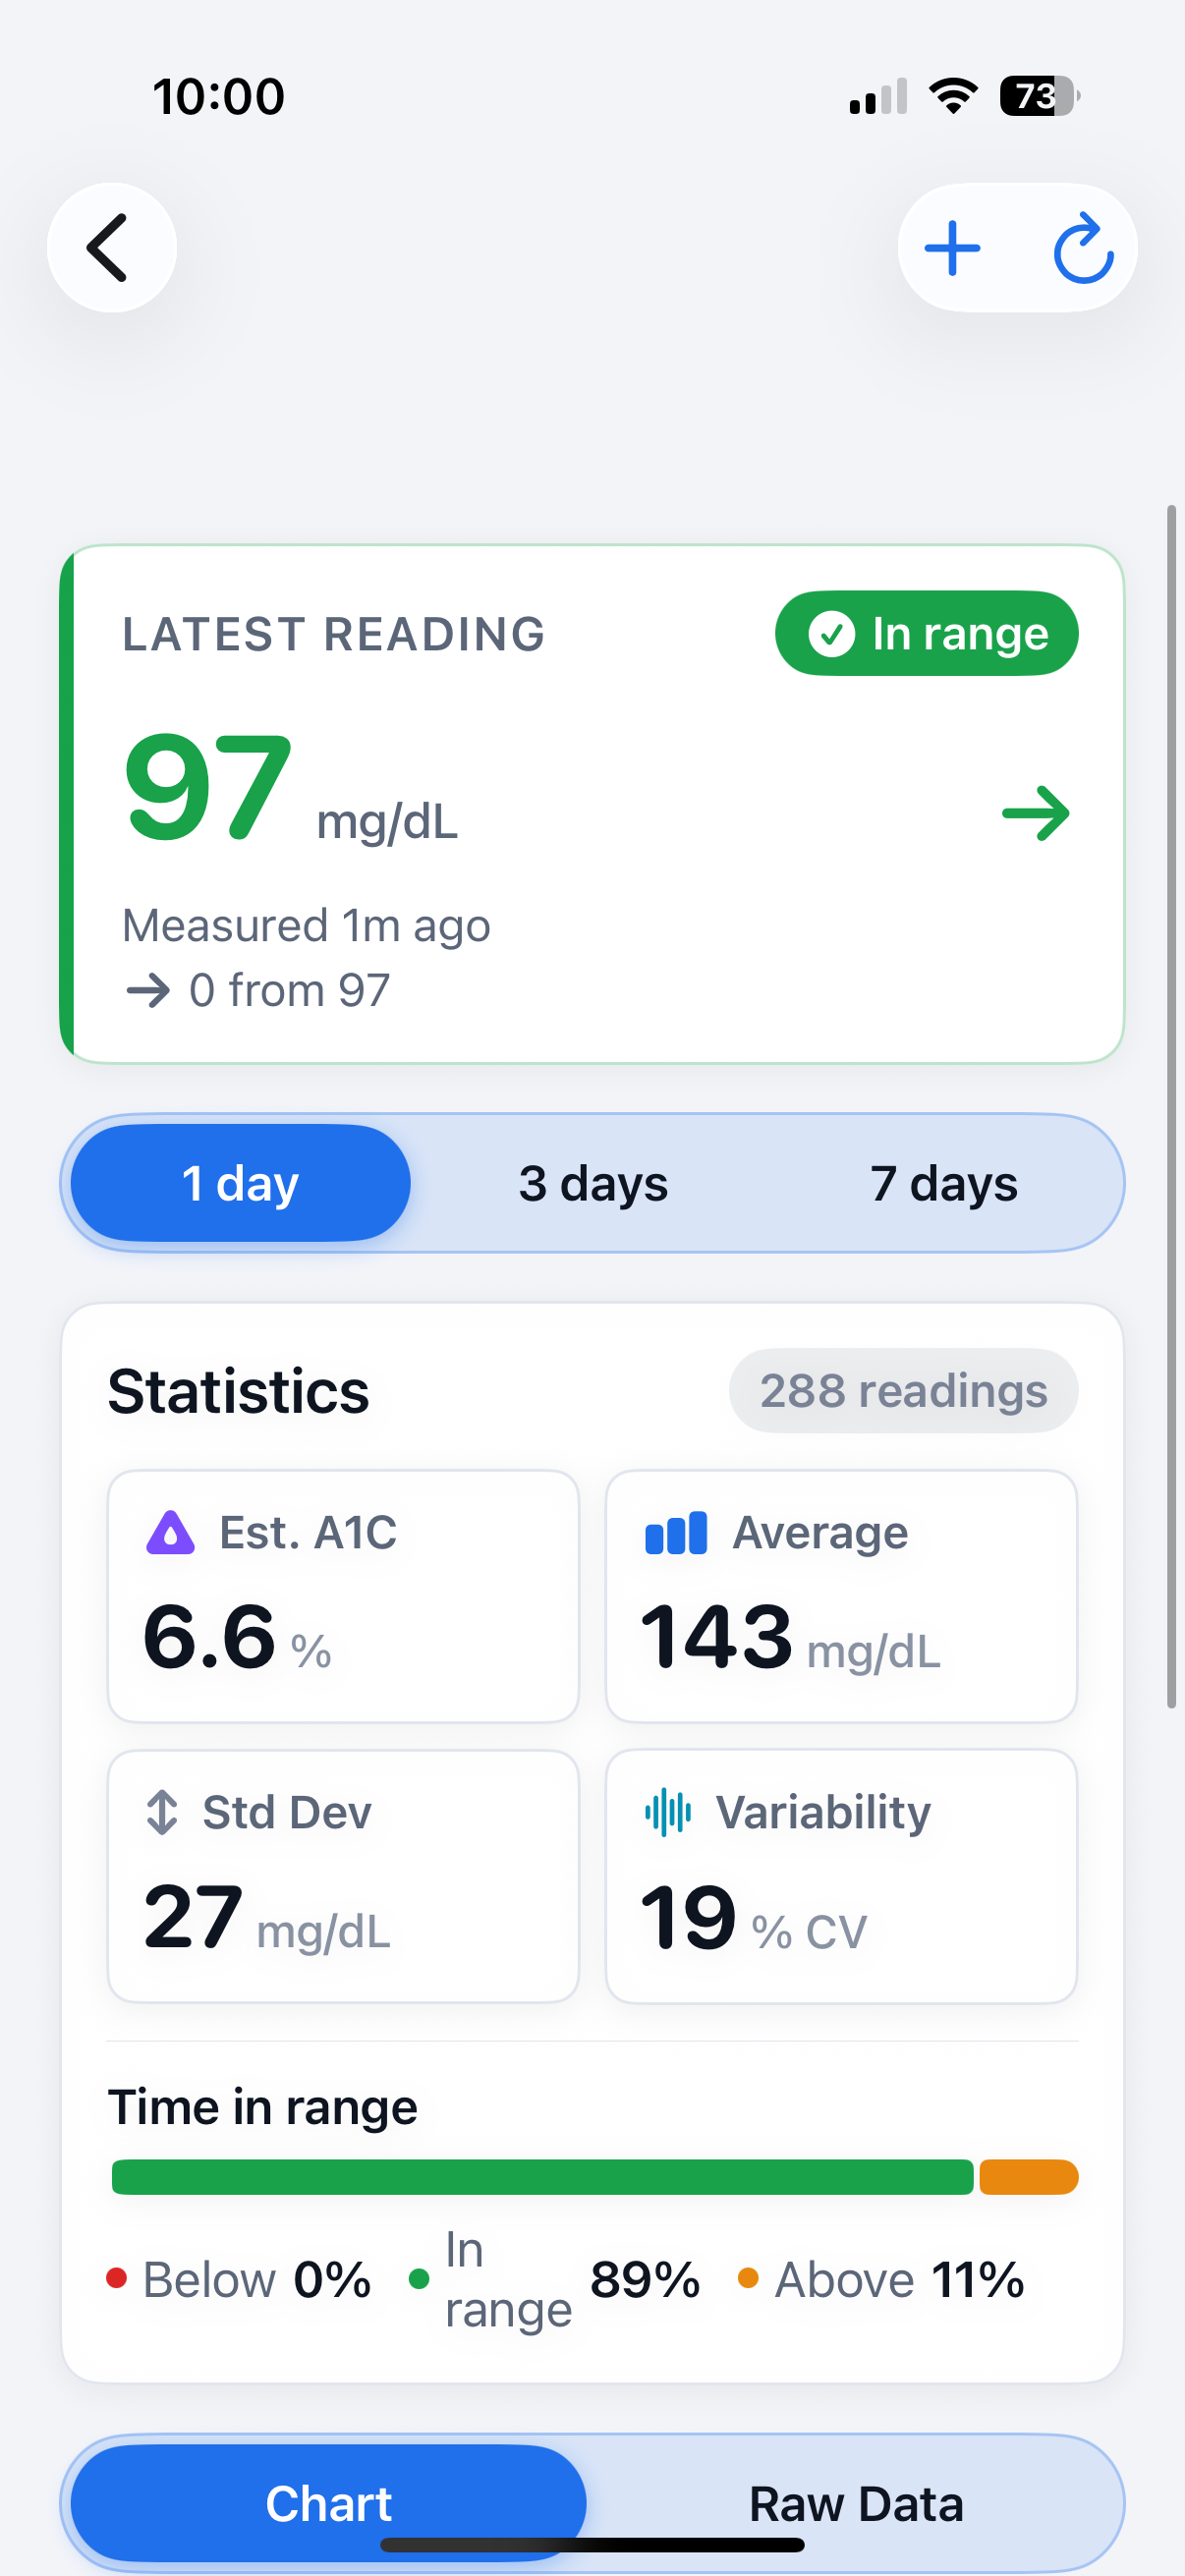
Shows your latest reading, then statistics for a selectable window (1/3/7 days): estimated A1C, average glucose, standard deviation, variability (%CV), and time-in-range breakdown. Toggle between a Chart view and Raw Data view further down the screen. In manual-entry mode, tap the + button to add a reading yourself.
Chapter 7
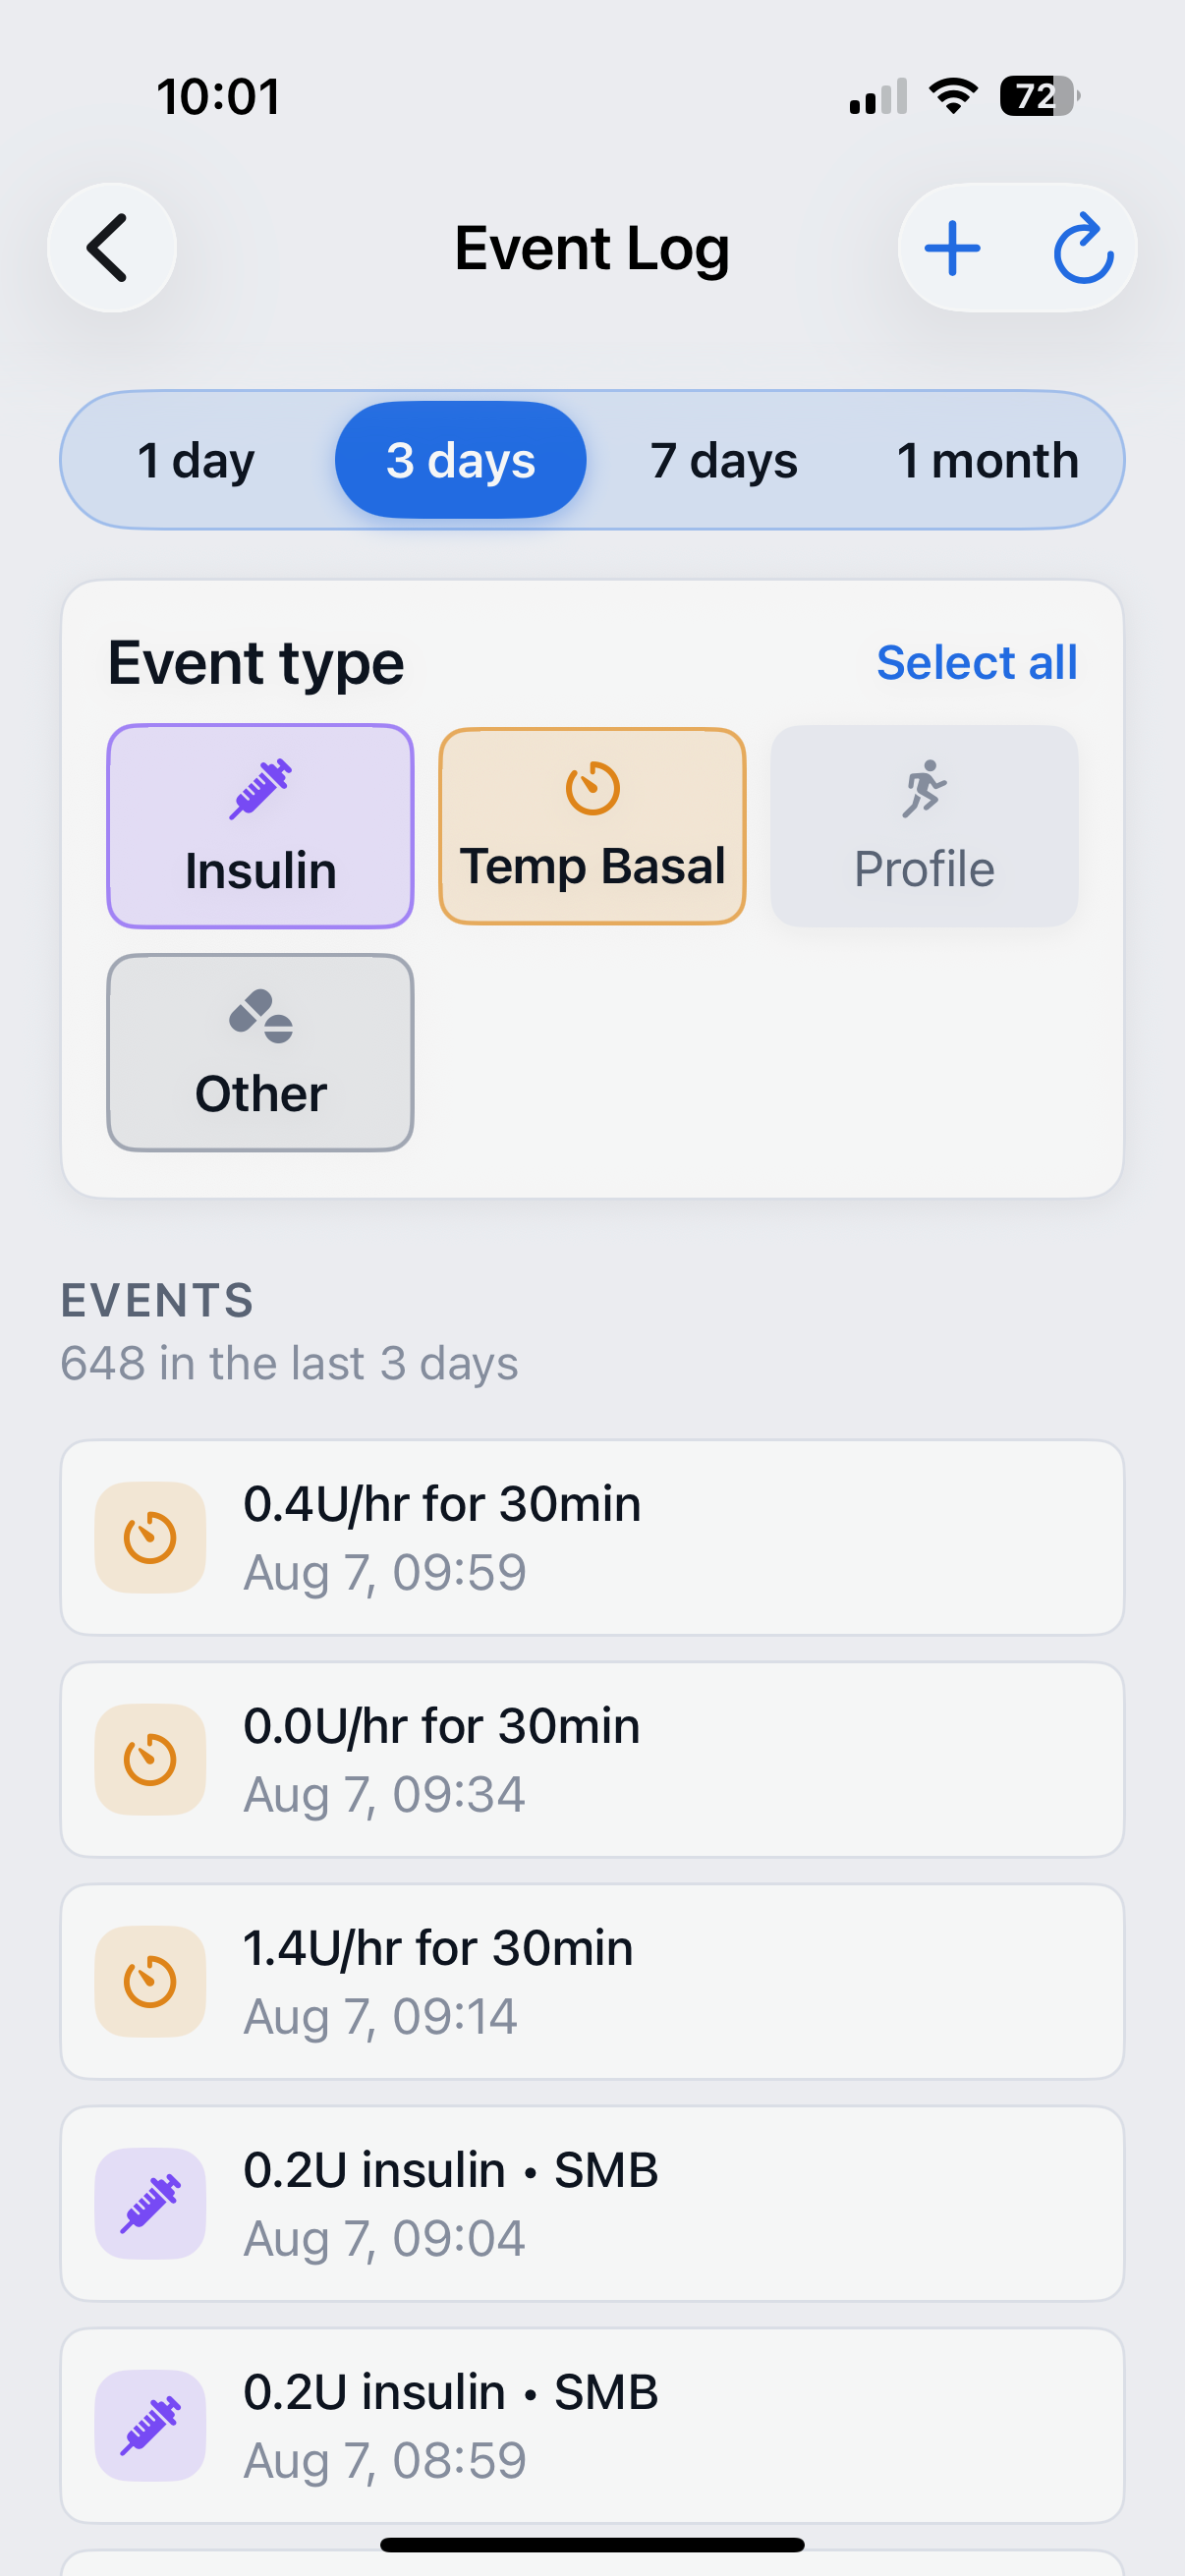
A single timeline of everything you or your pump/CGM logged: insulin, carbs, temp basal, profile changes, and other events. Filter by event type using the chips at the top, and choose a time window (1 day / 3 days / 7 days / 1 month). Tap + to add an event manually.
Chapter 8
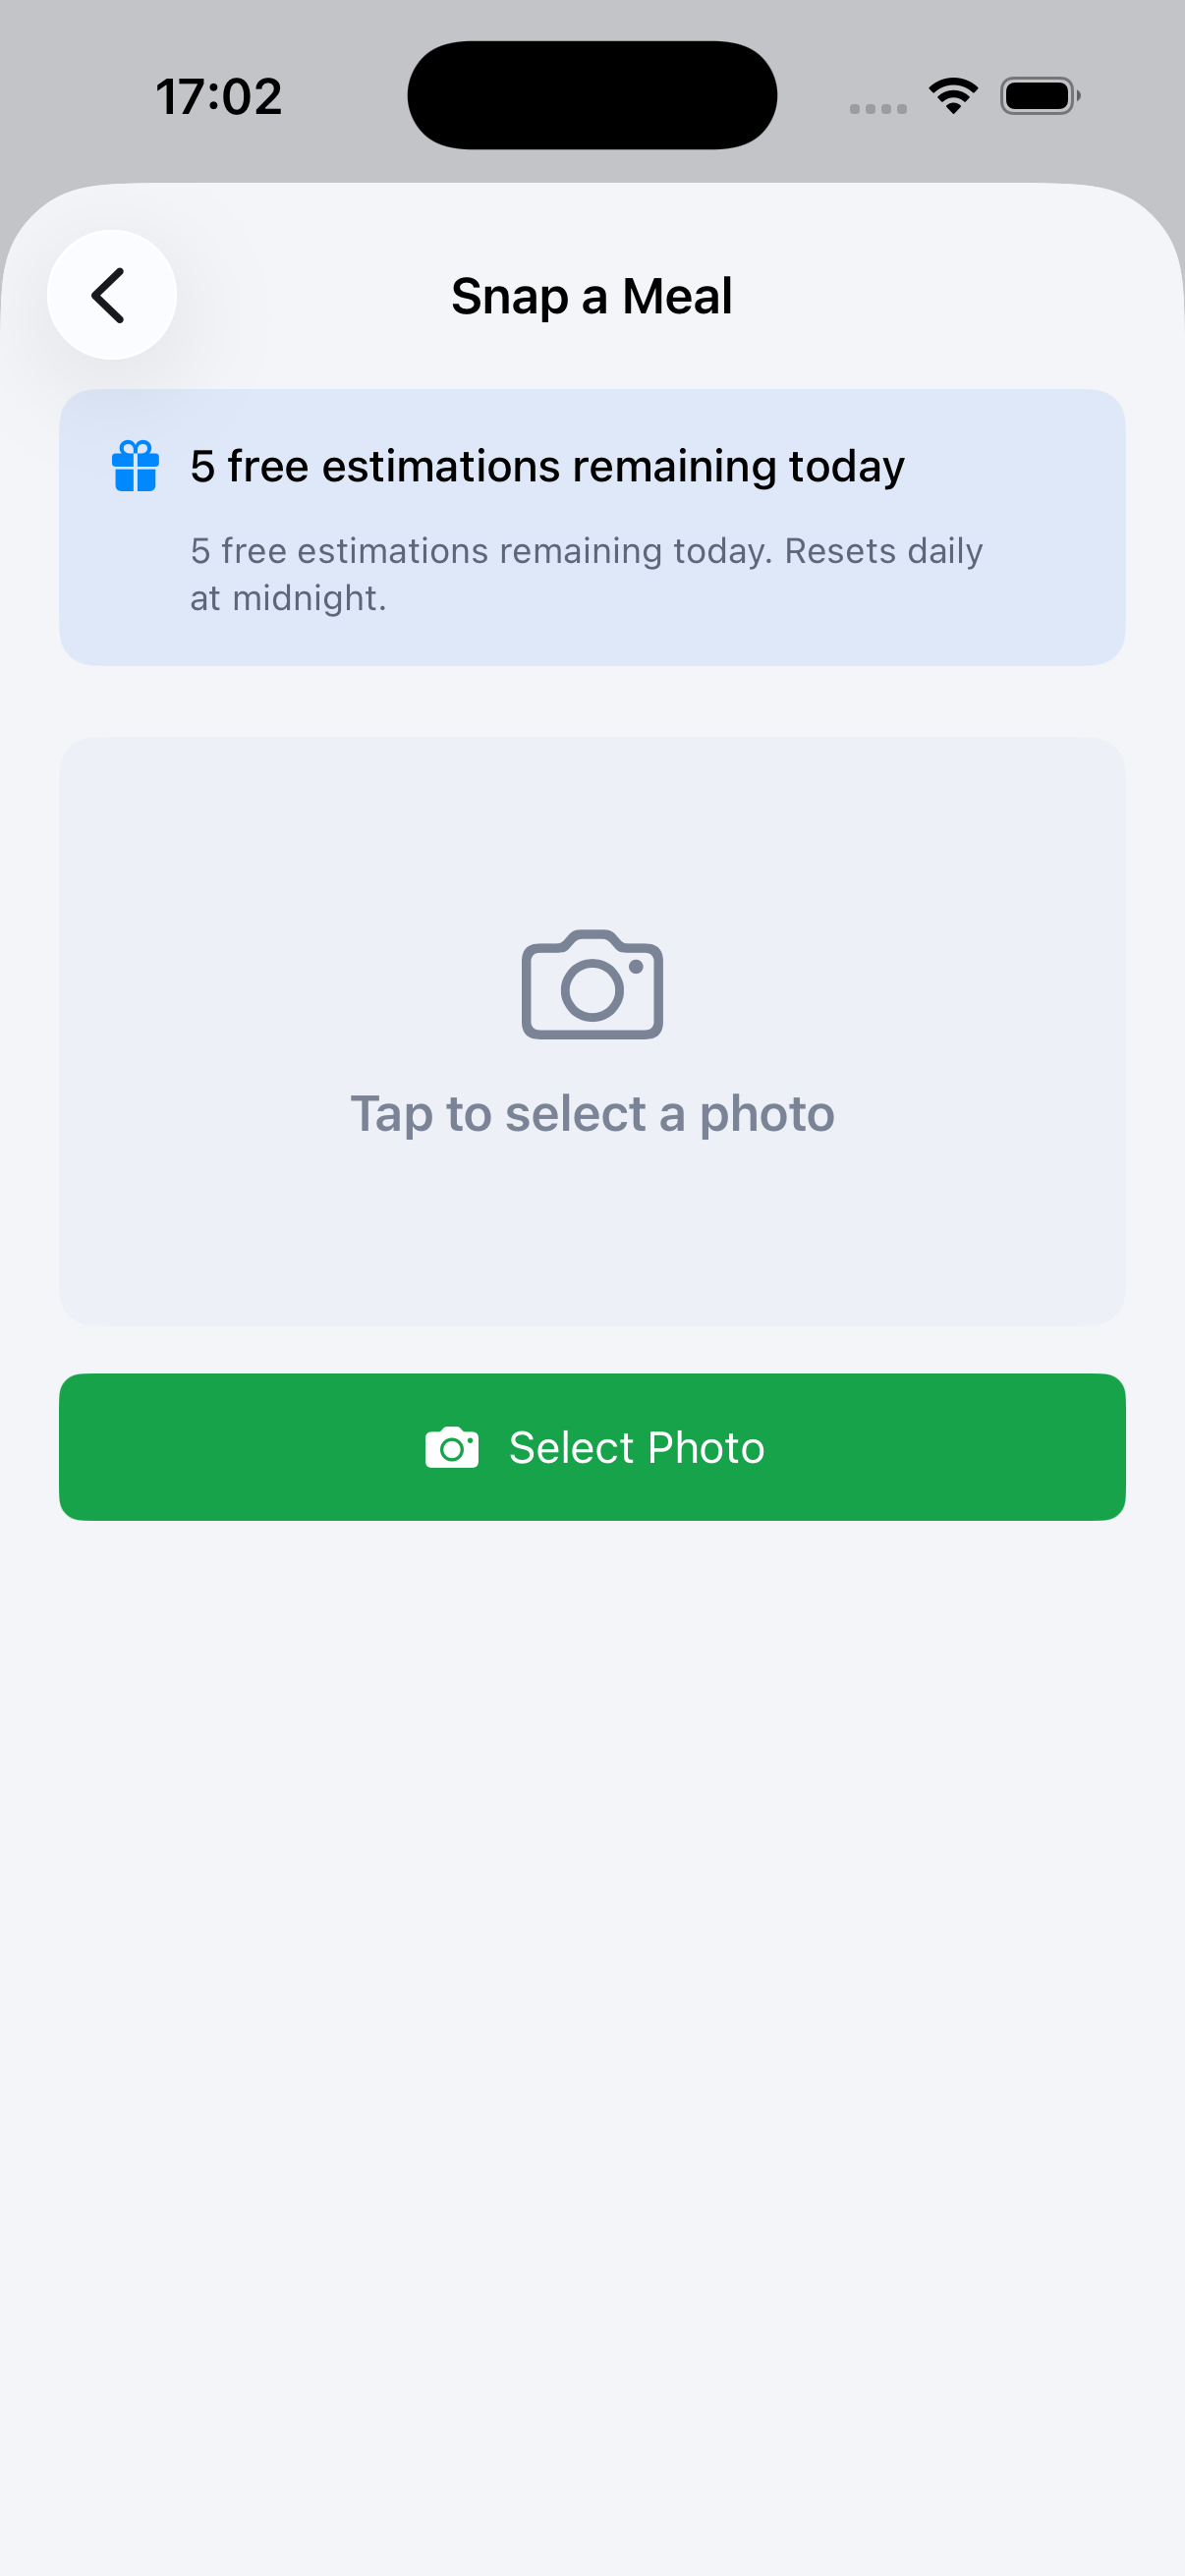
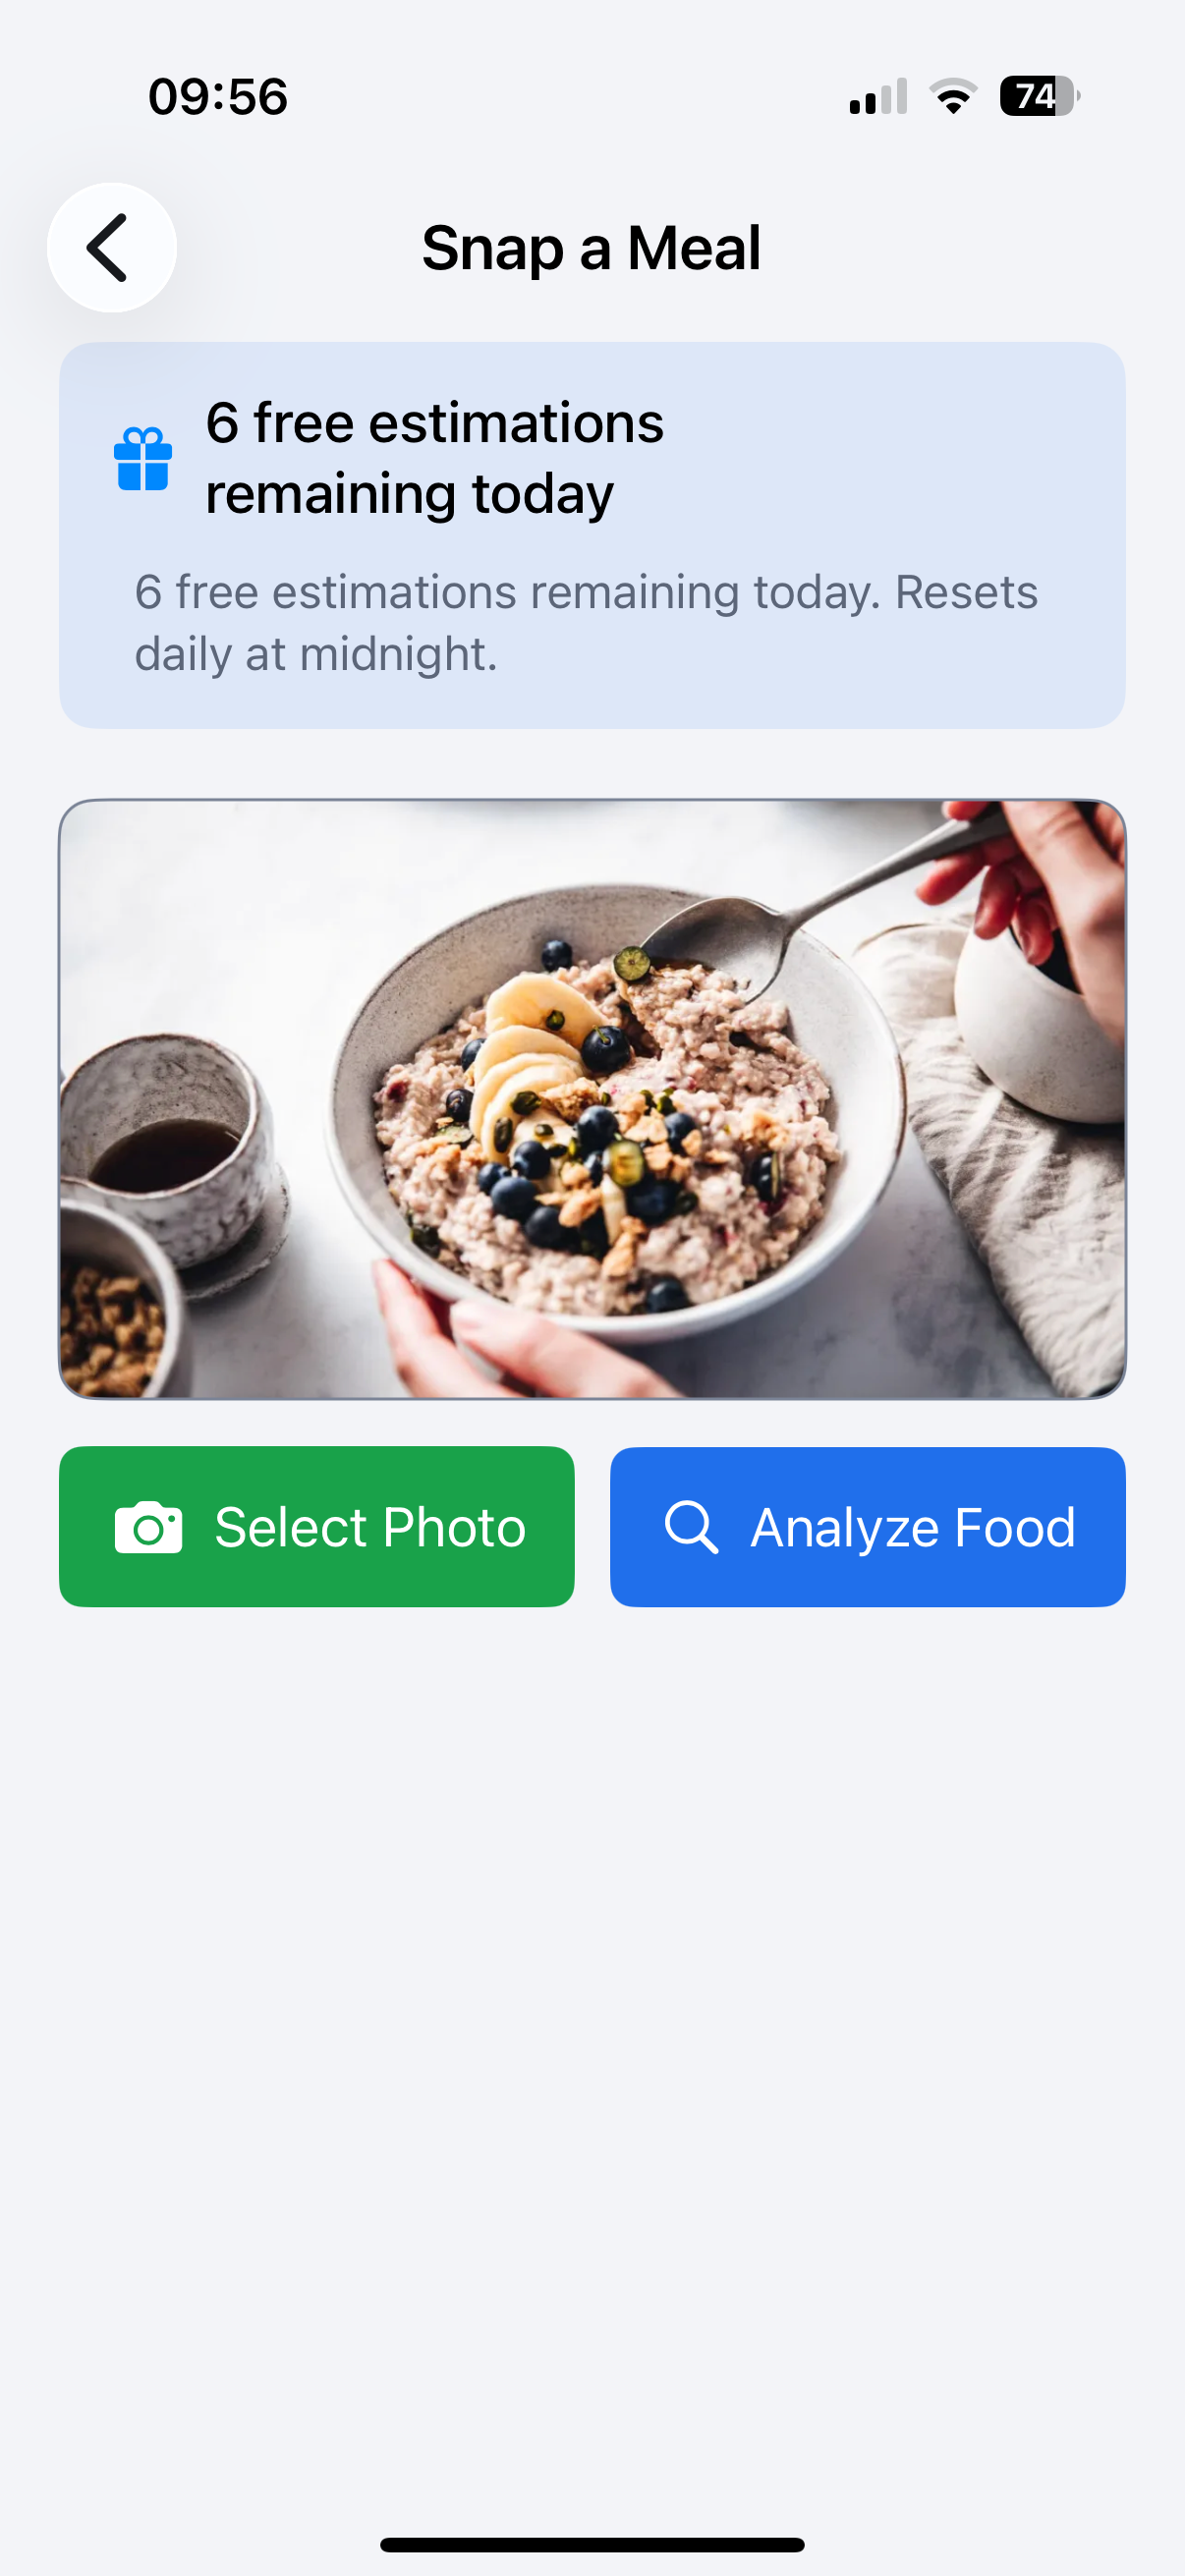
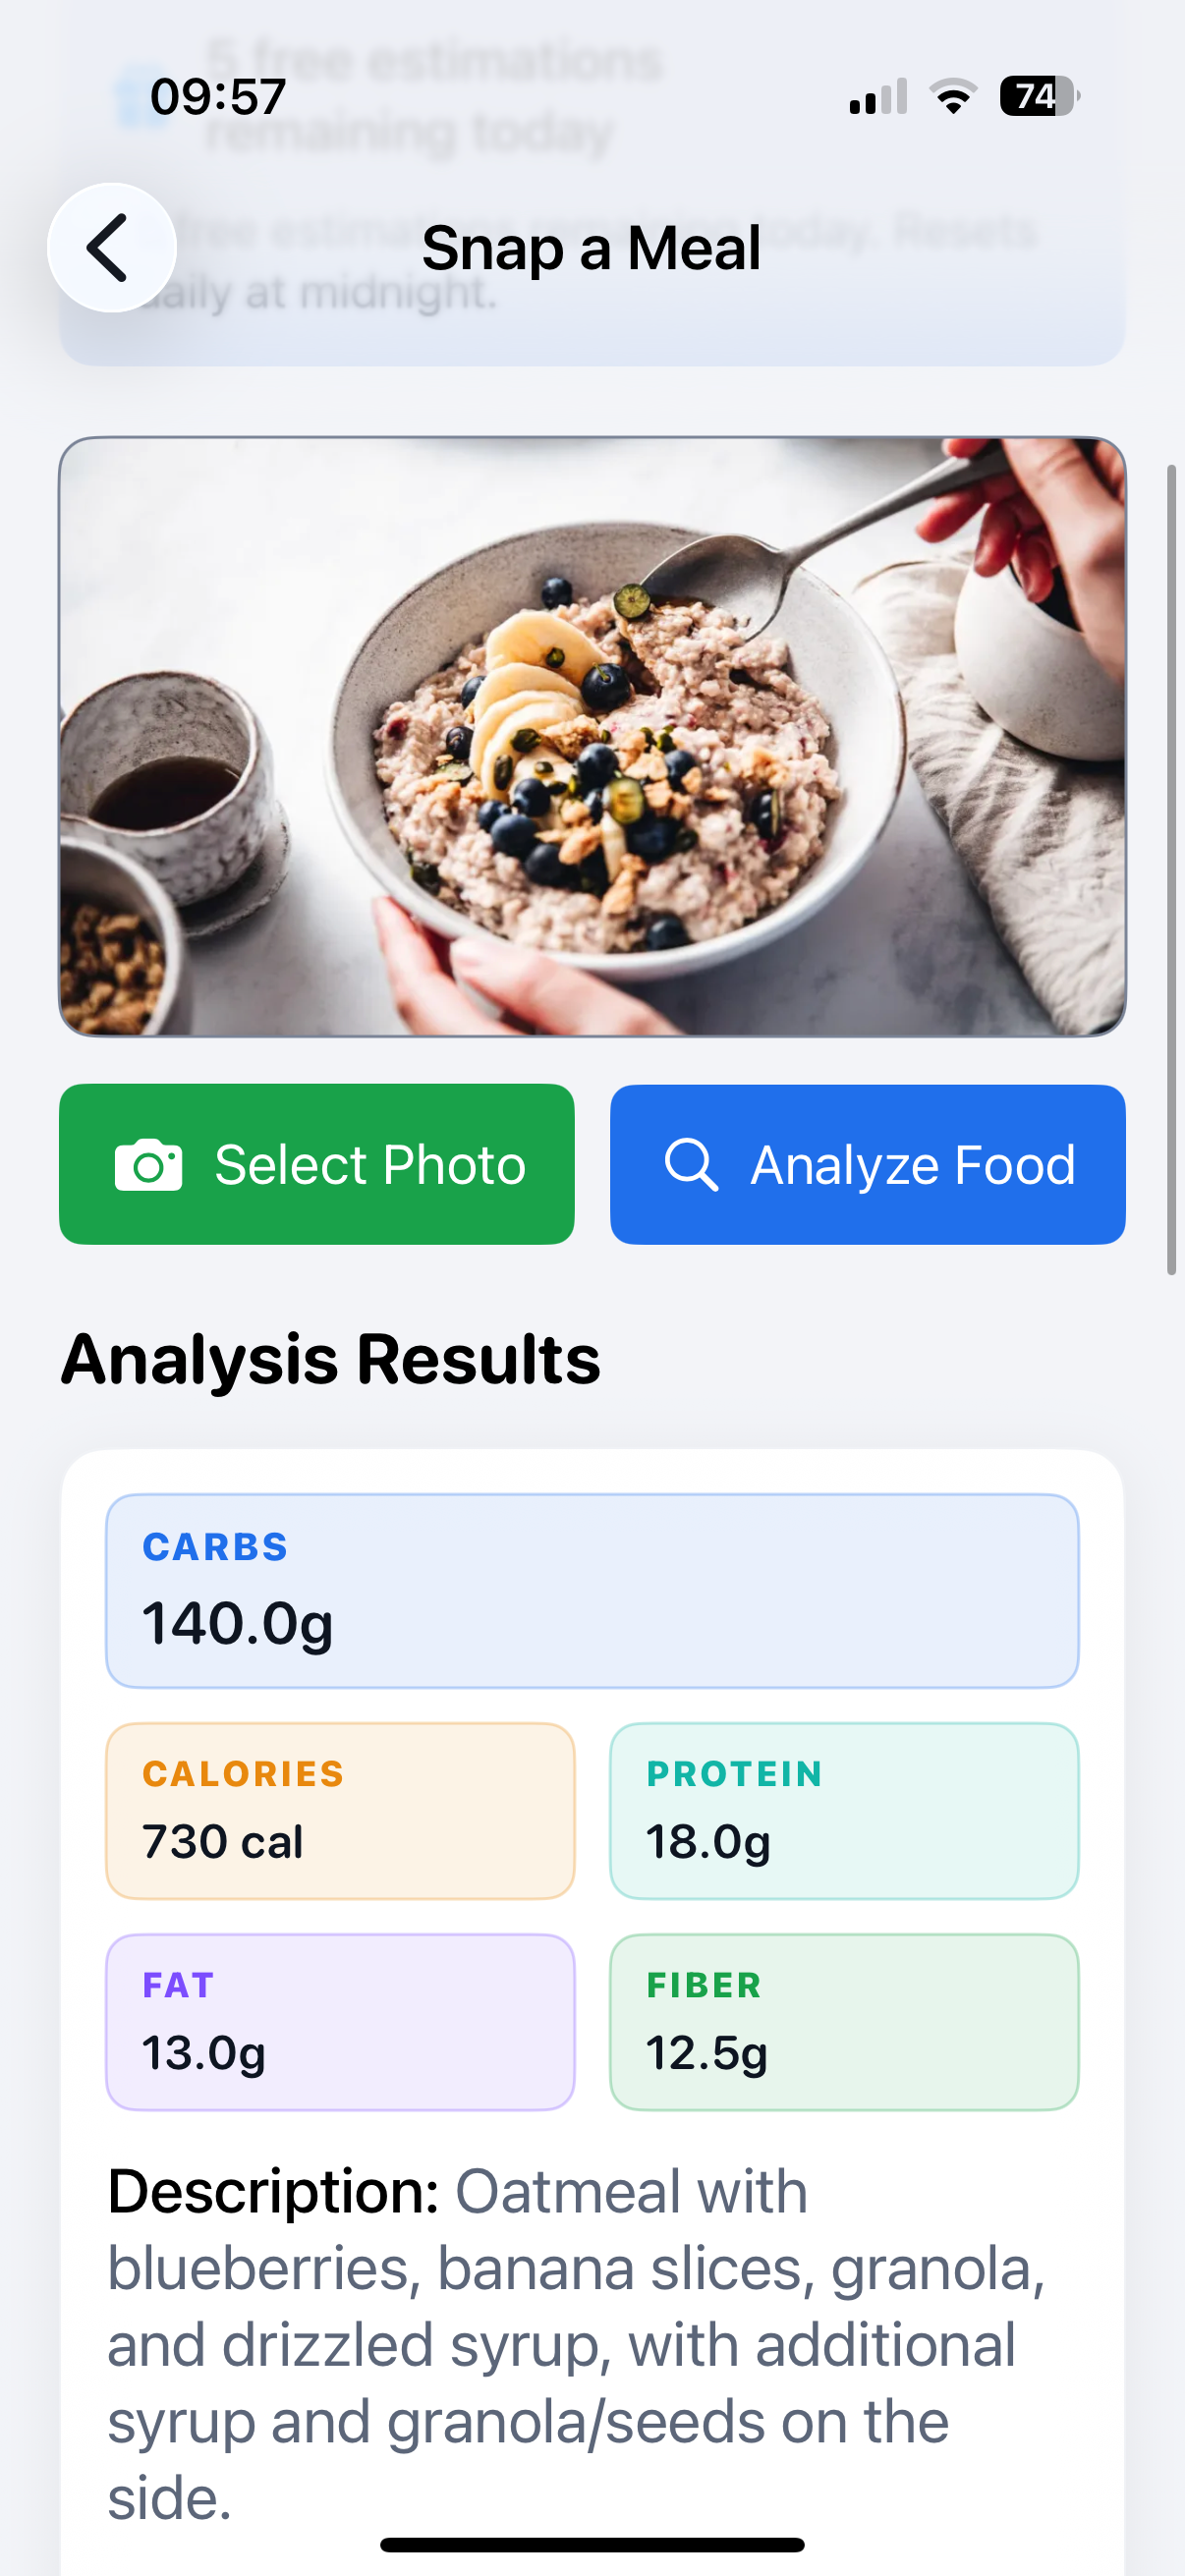
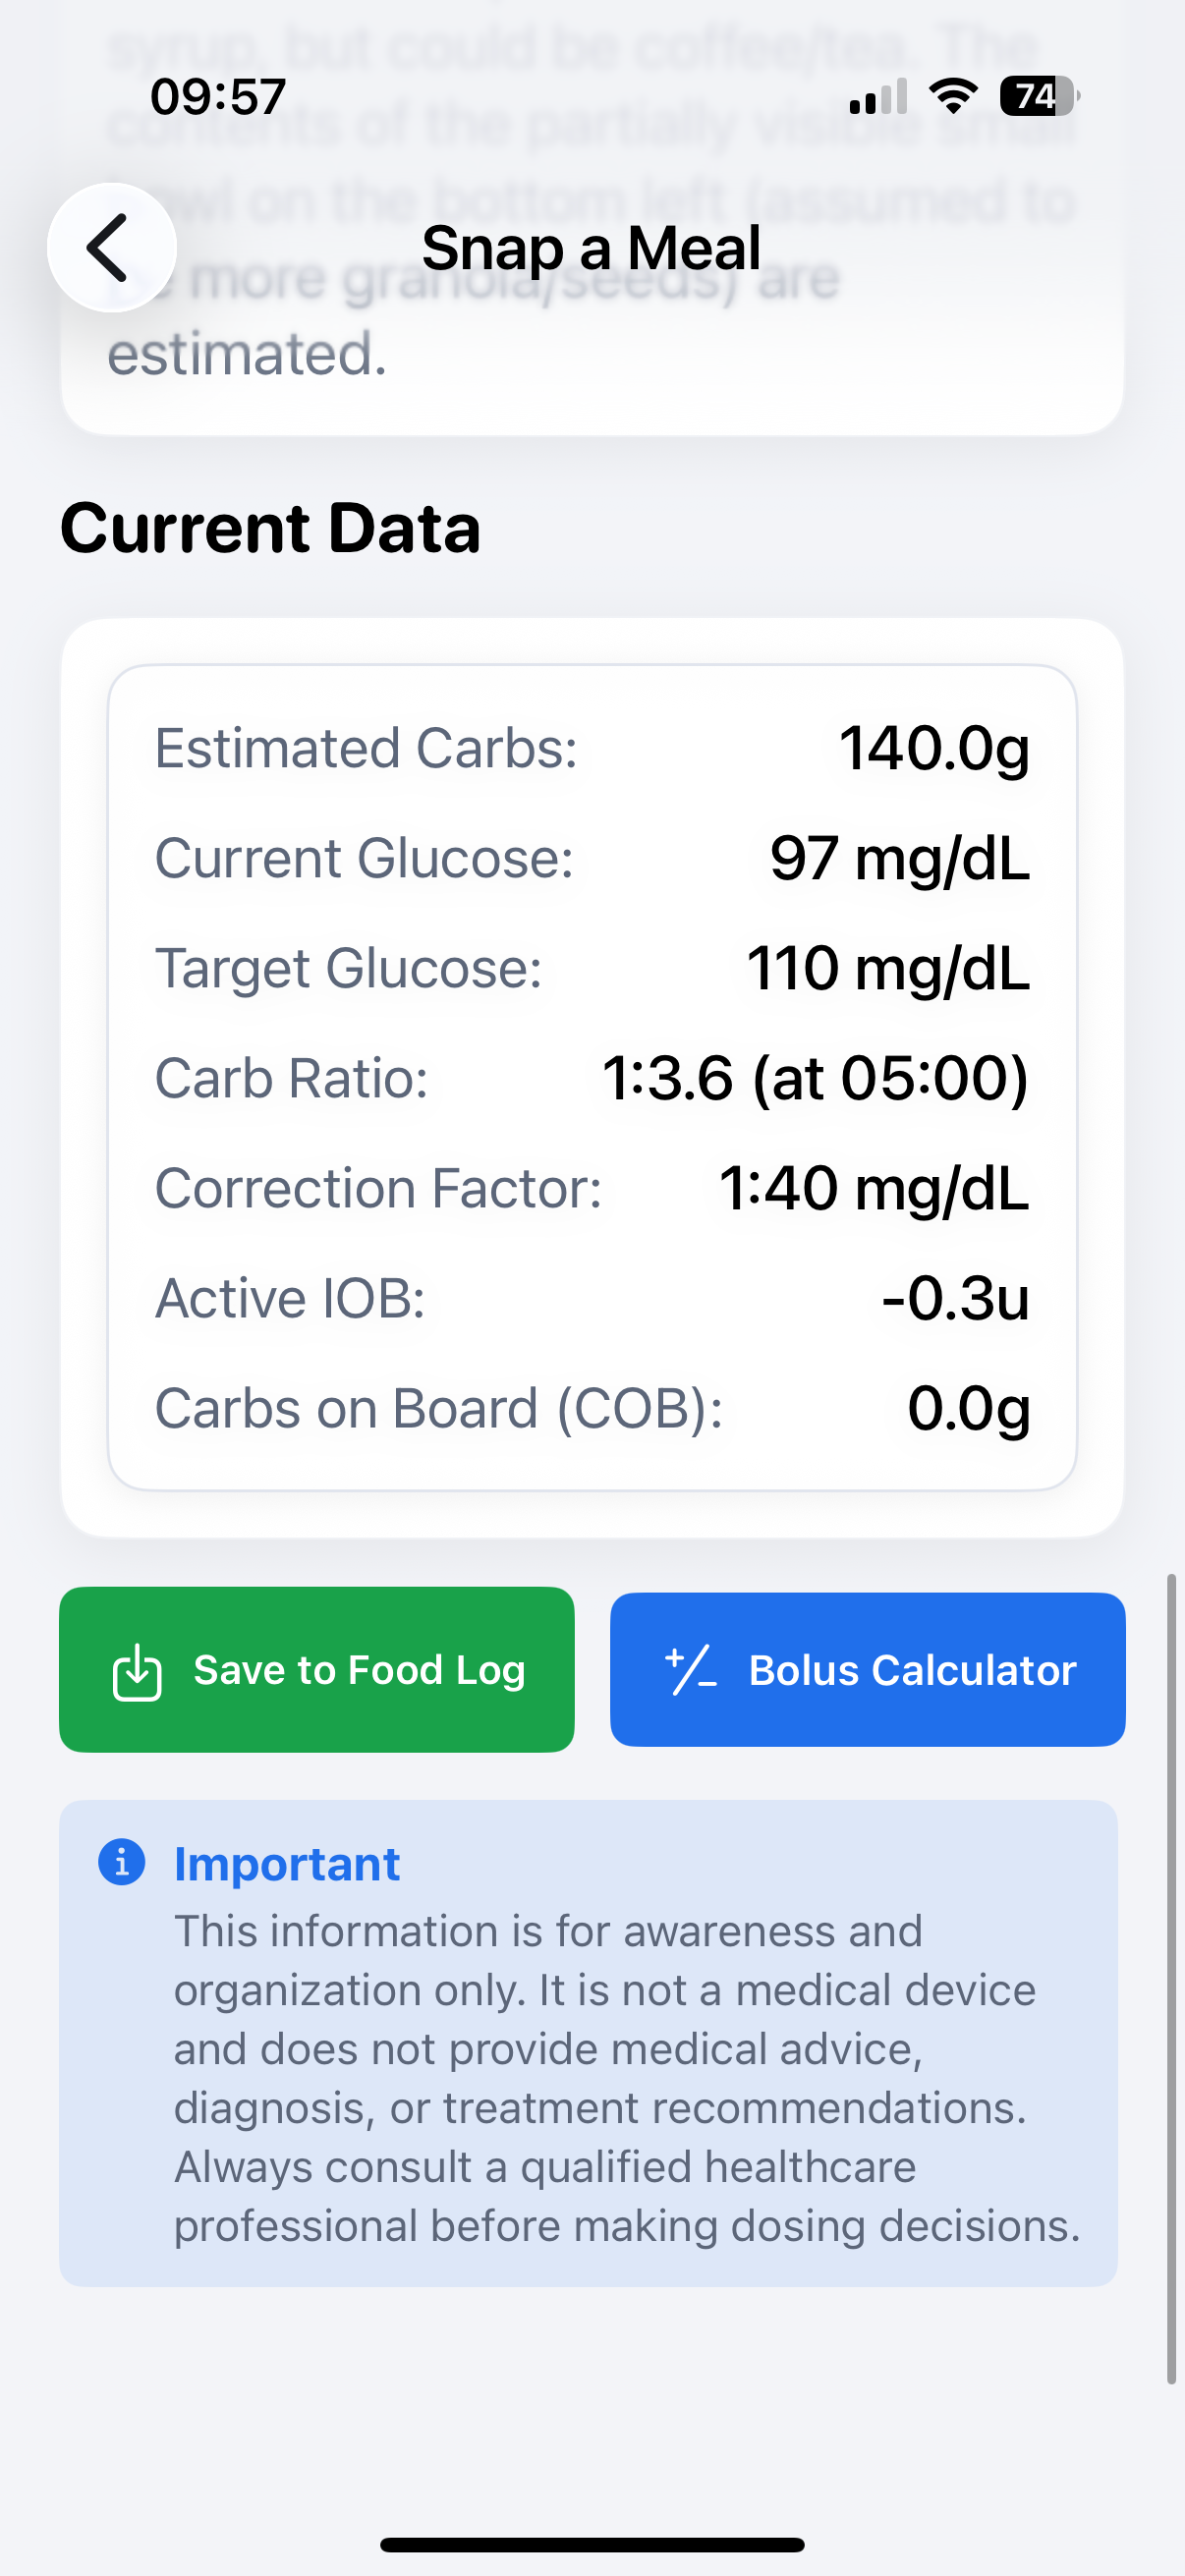
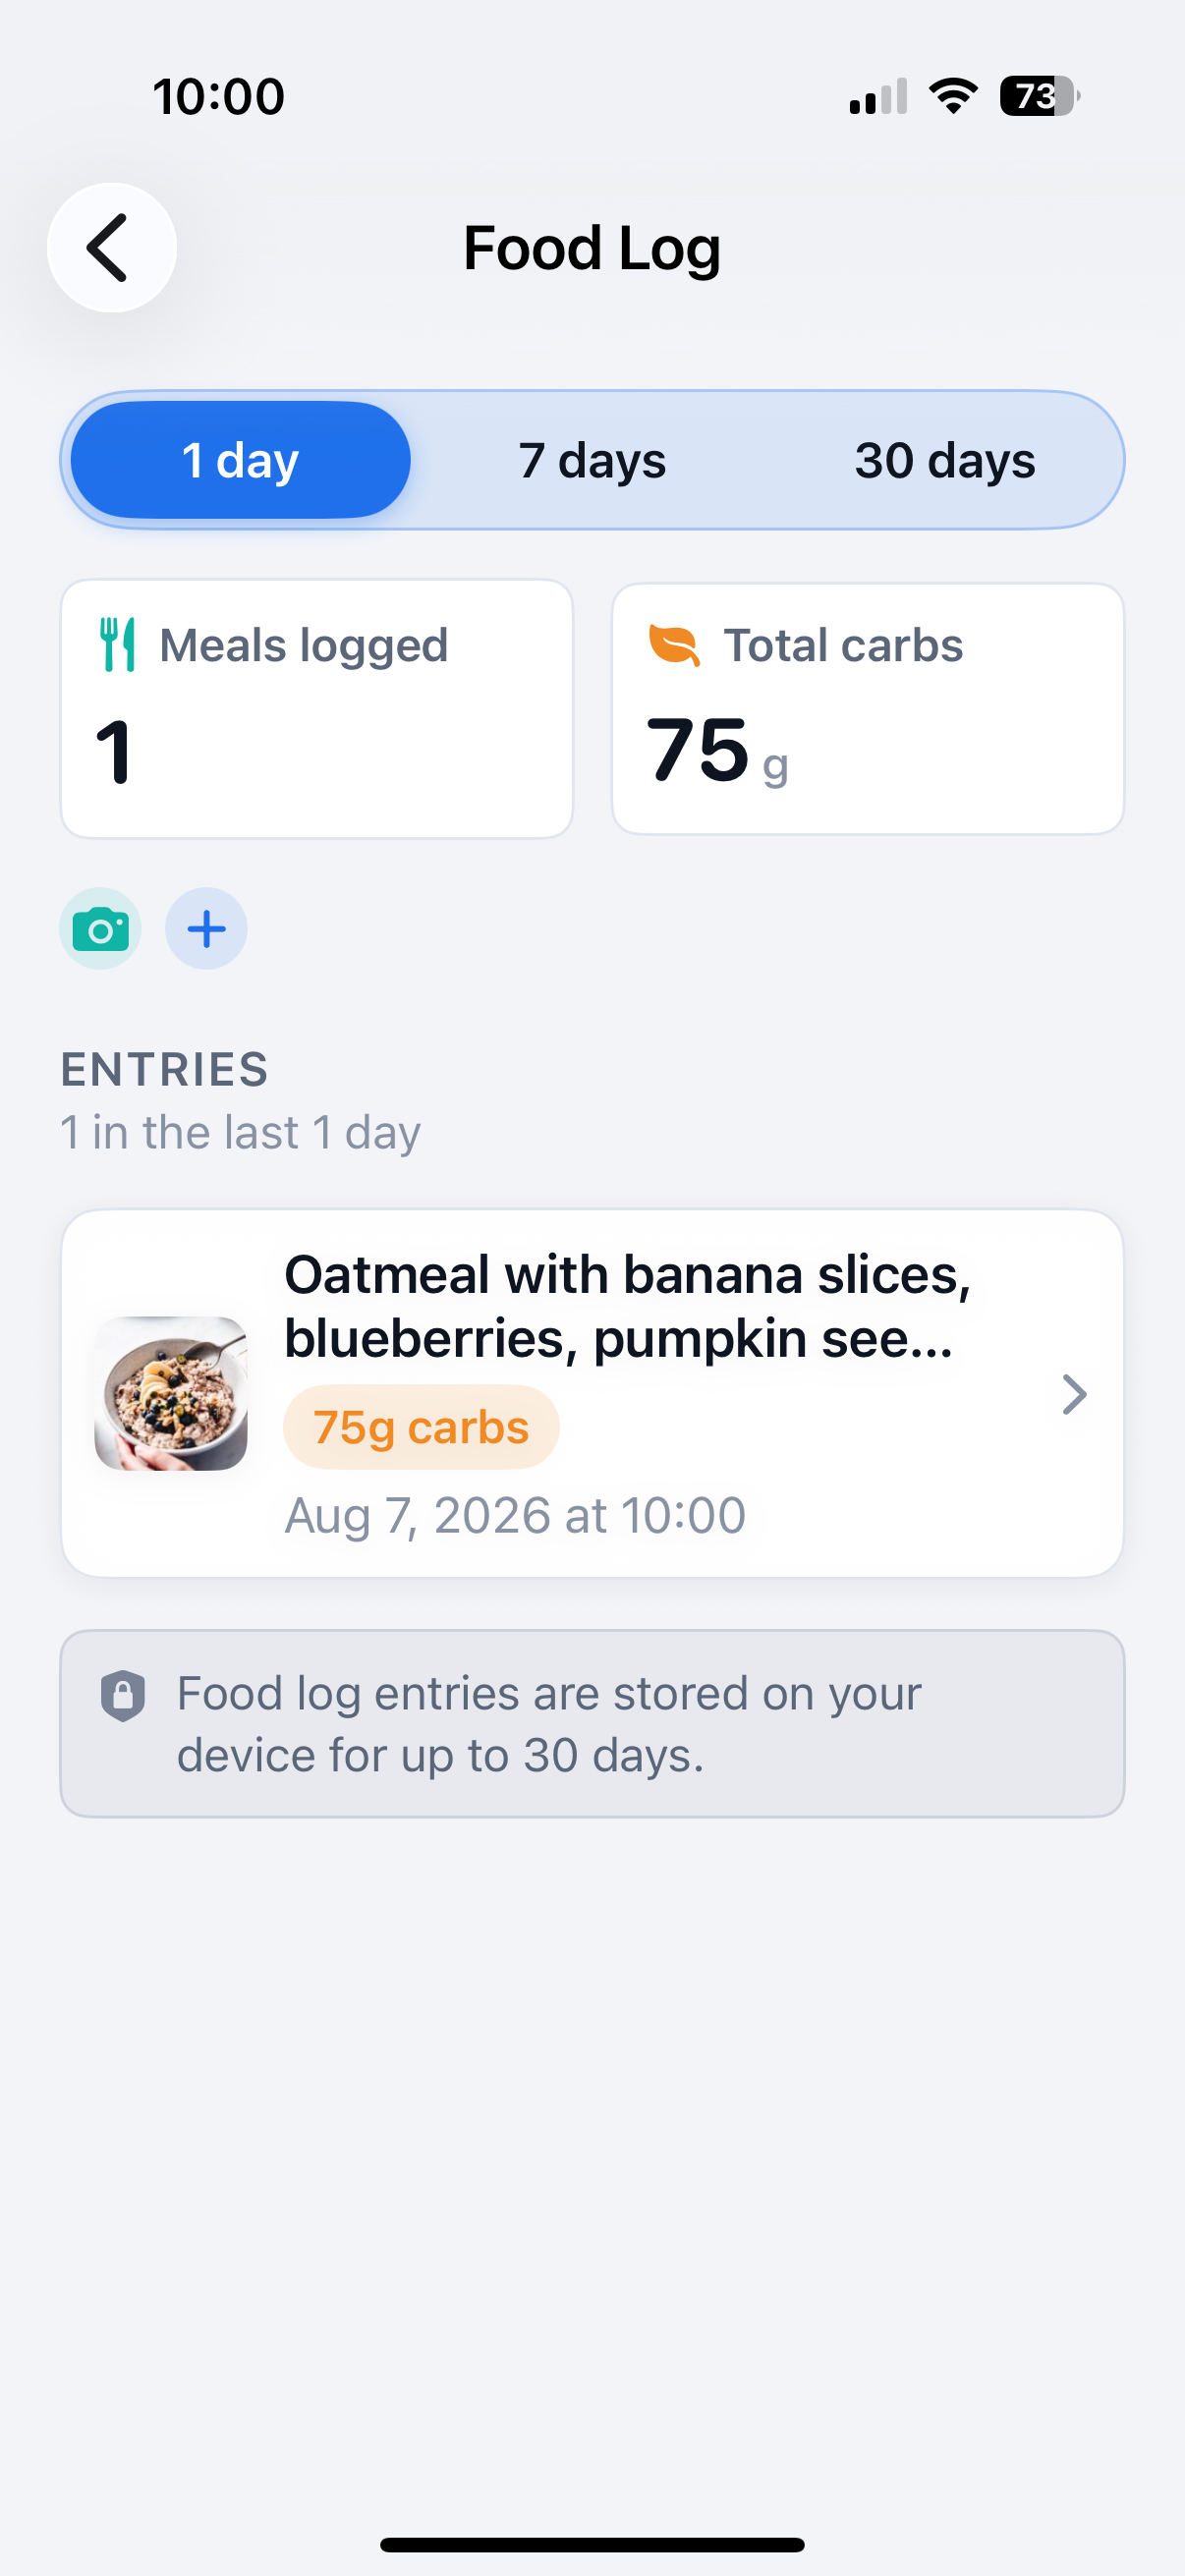
Snap a Meal takes a photo of your food and returns a photo-based carb estimate — a limited number of free estimations are available per day, resetting at midnight. Saved meals appear in the Food Log, which tracks meals-logged and total-carbs counts over 1/7/30-day windows; entries are stored on-device for up to 30 days.
Chapter 9
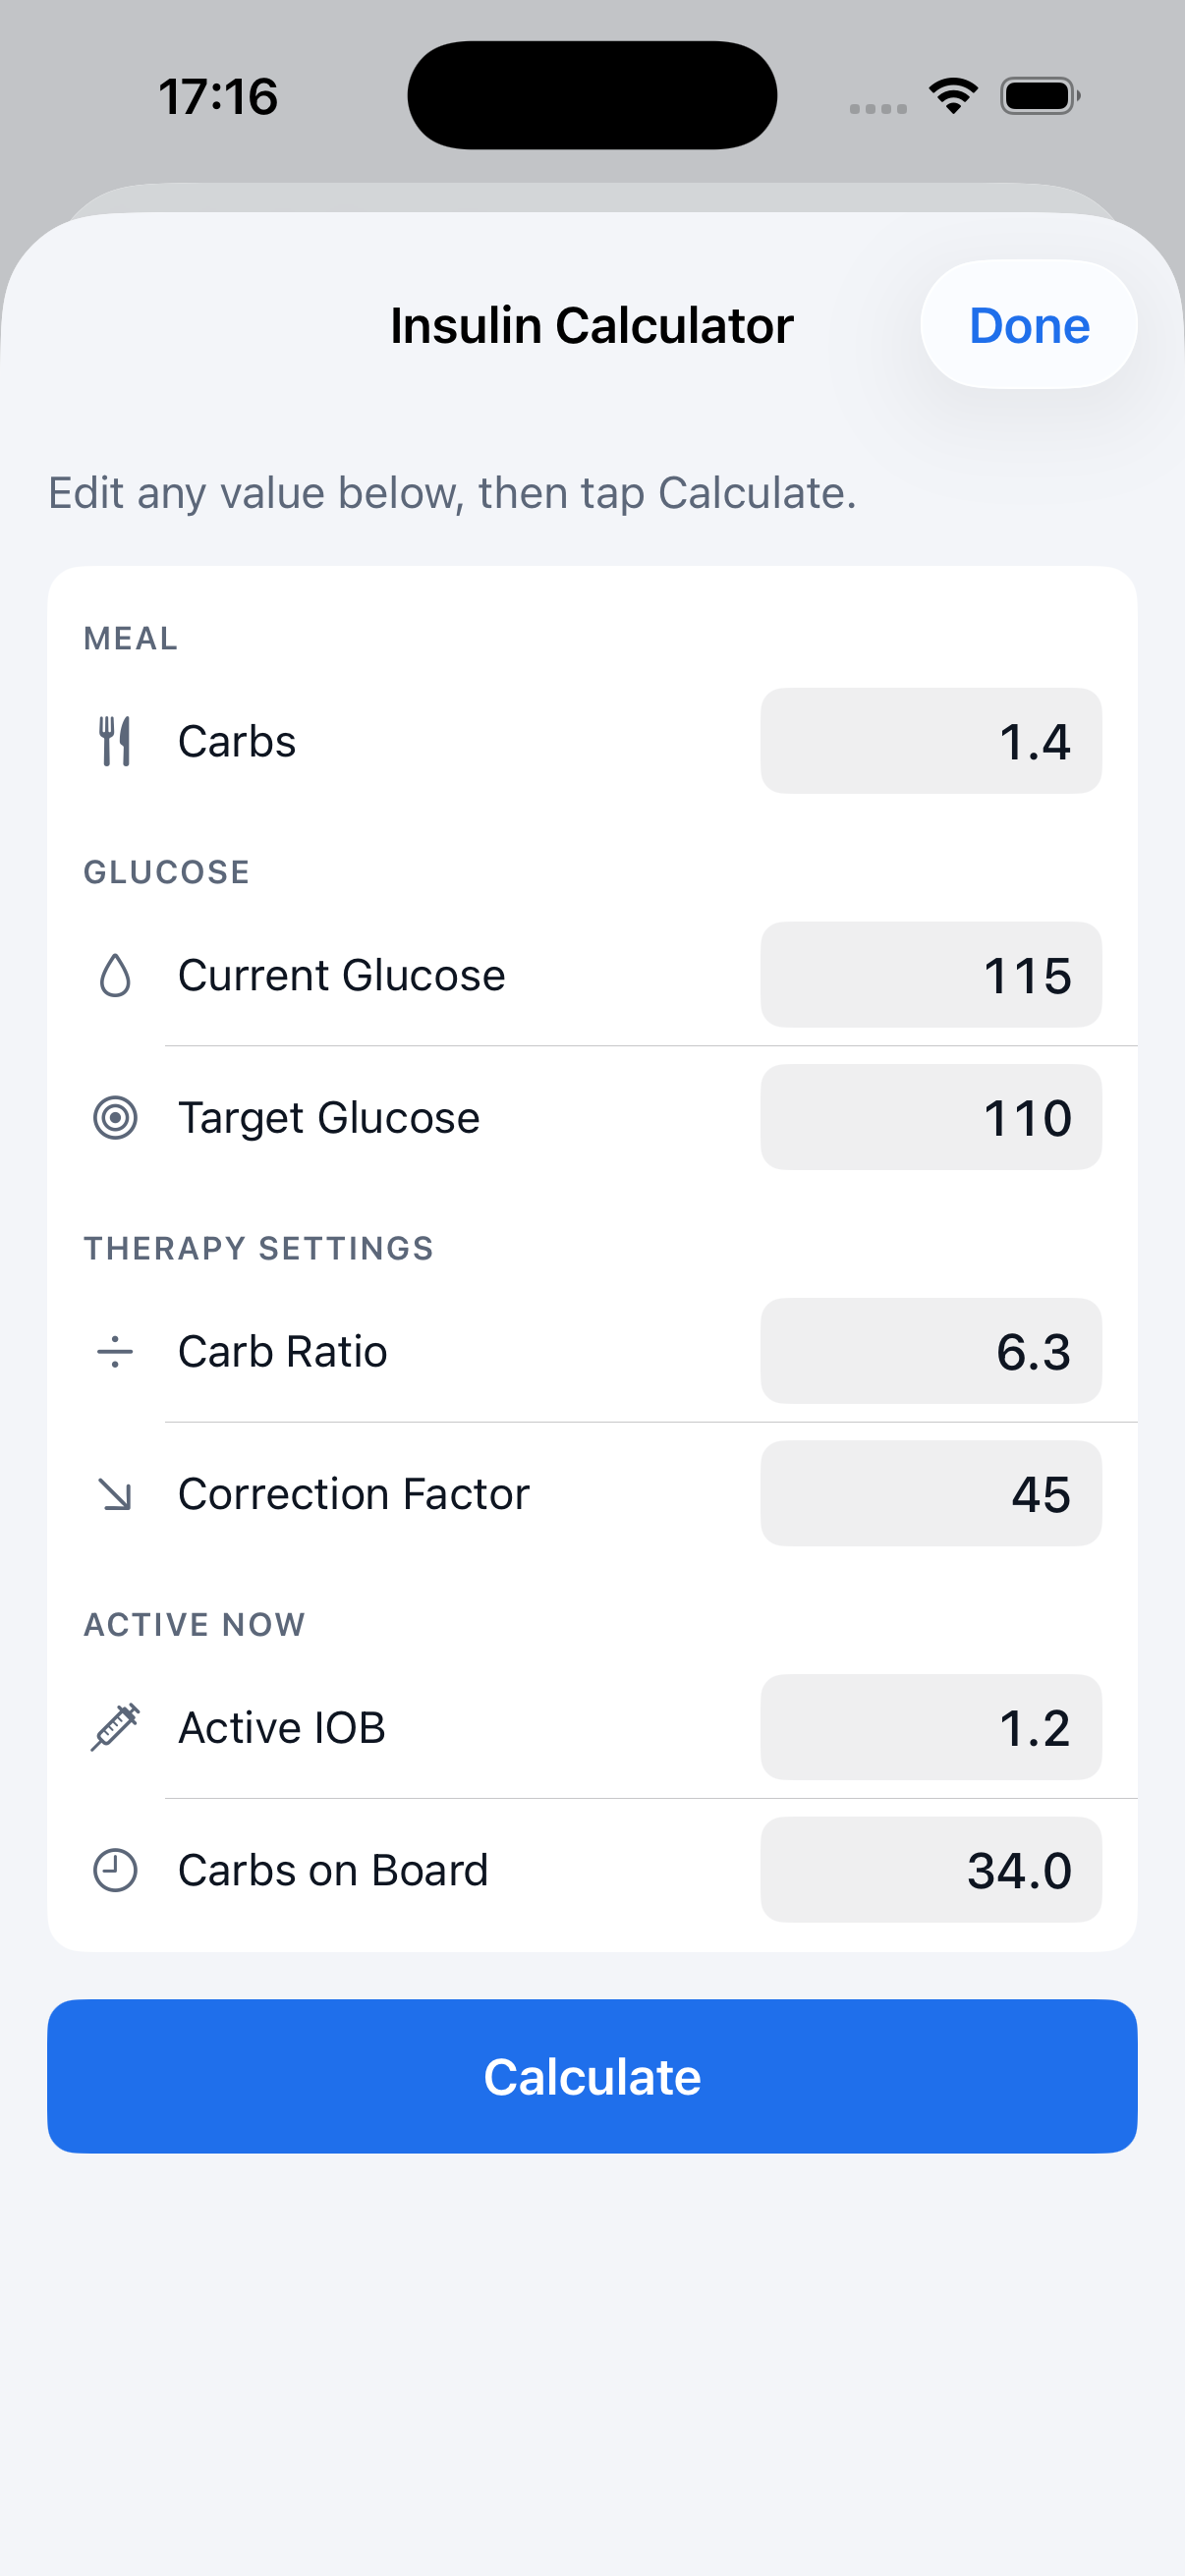
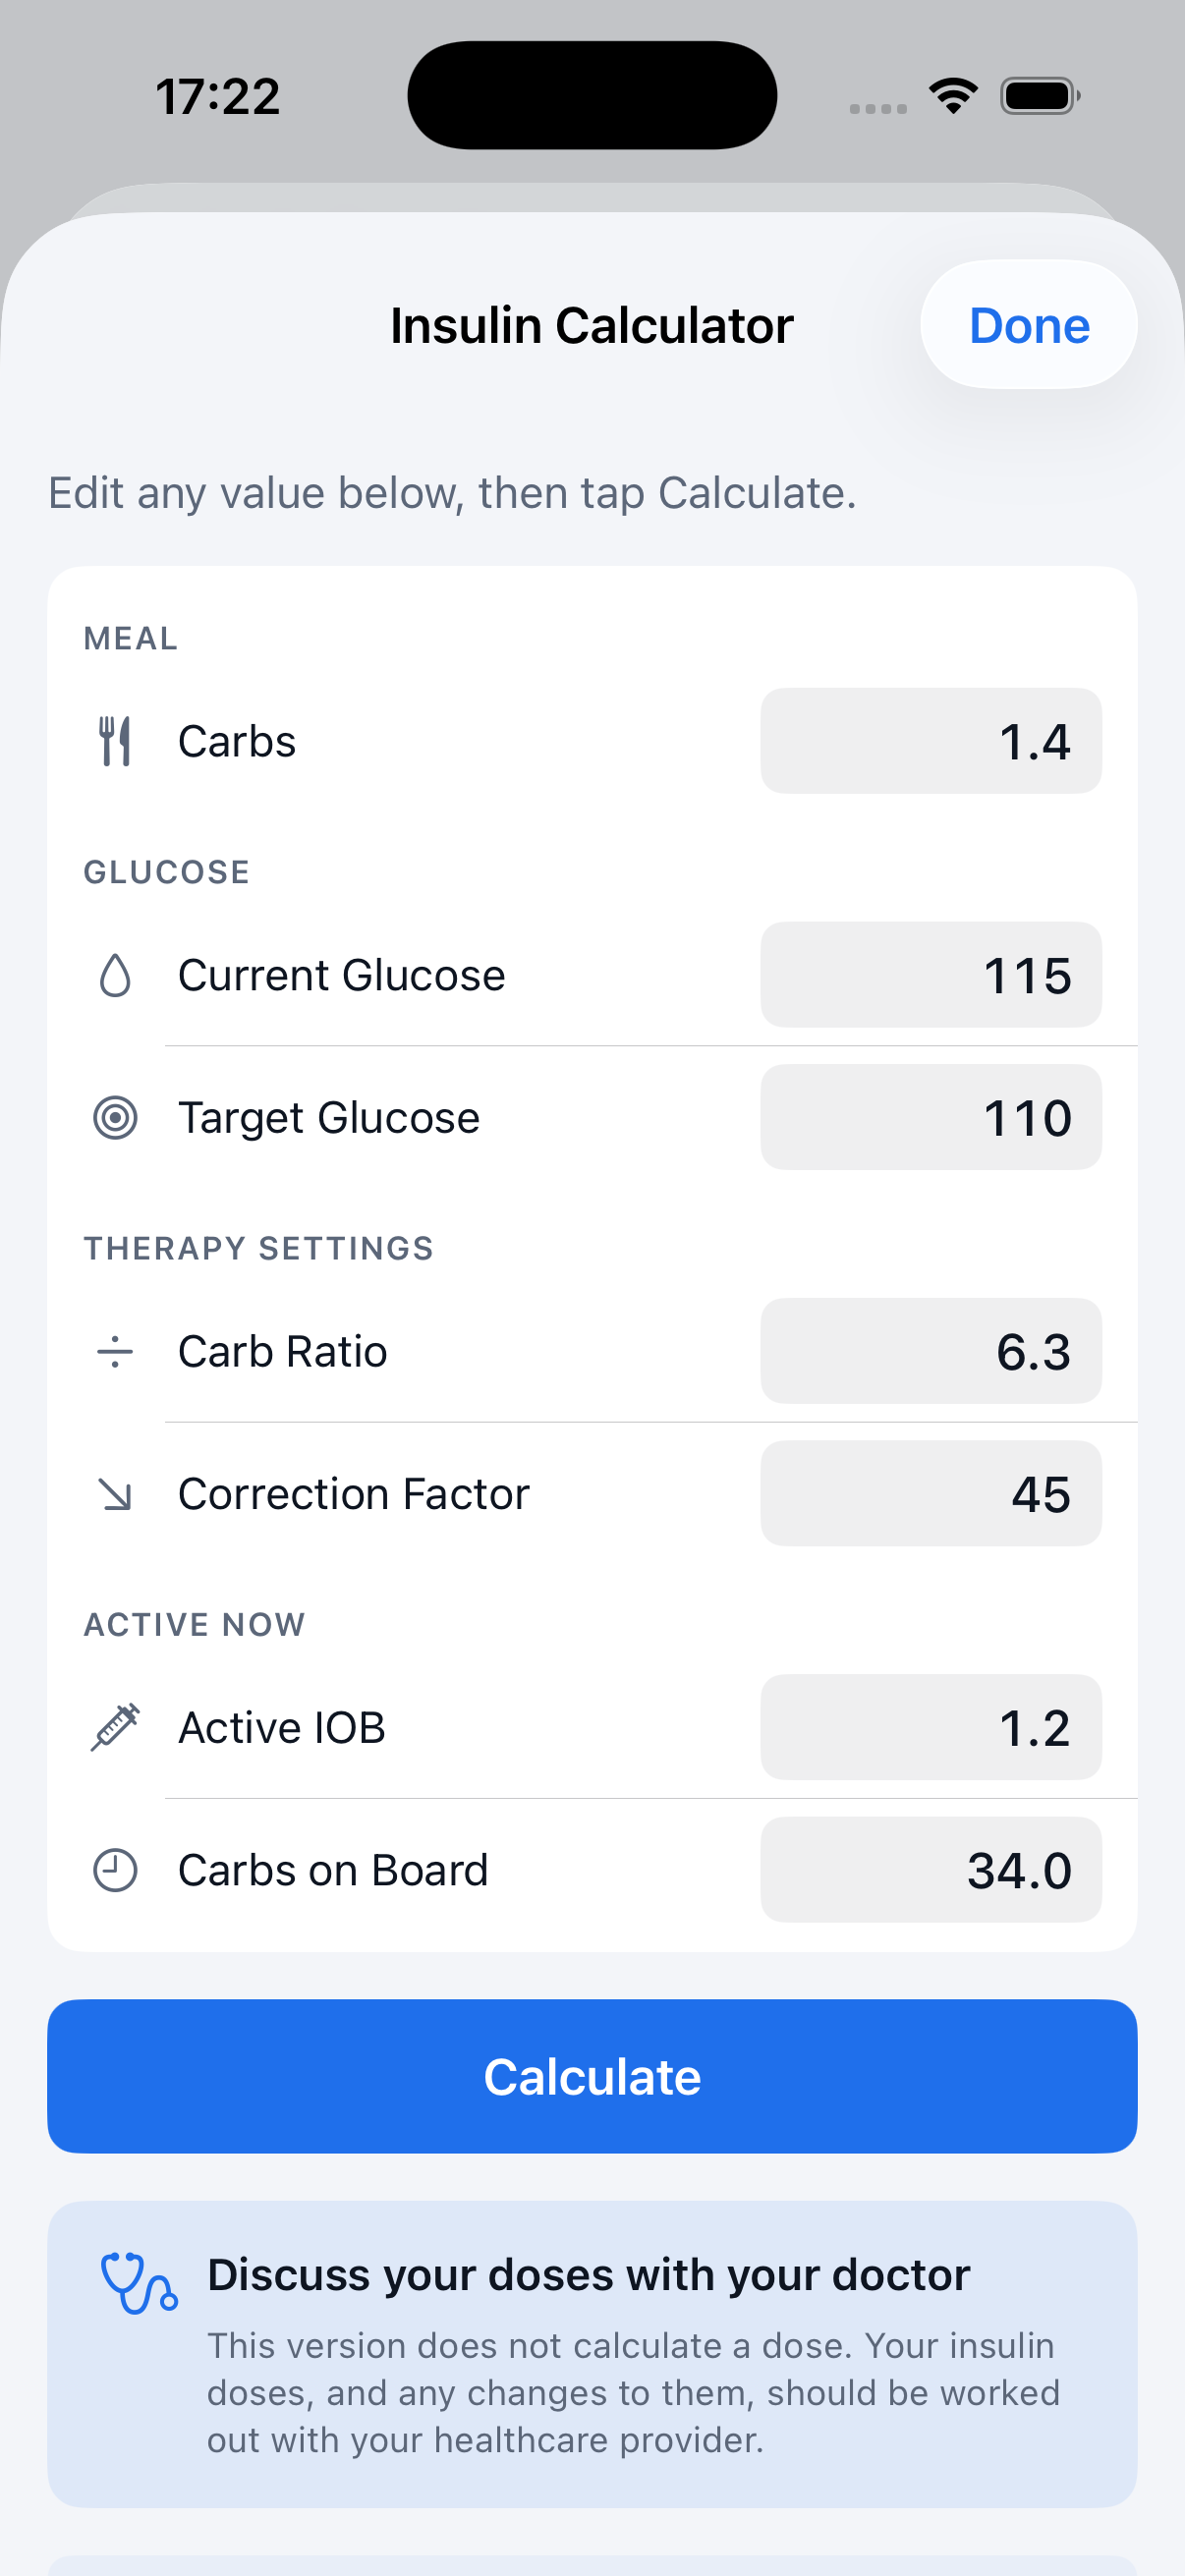
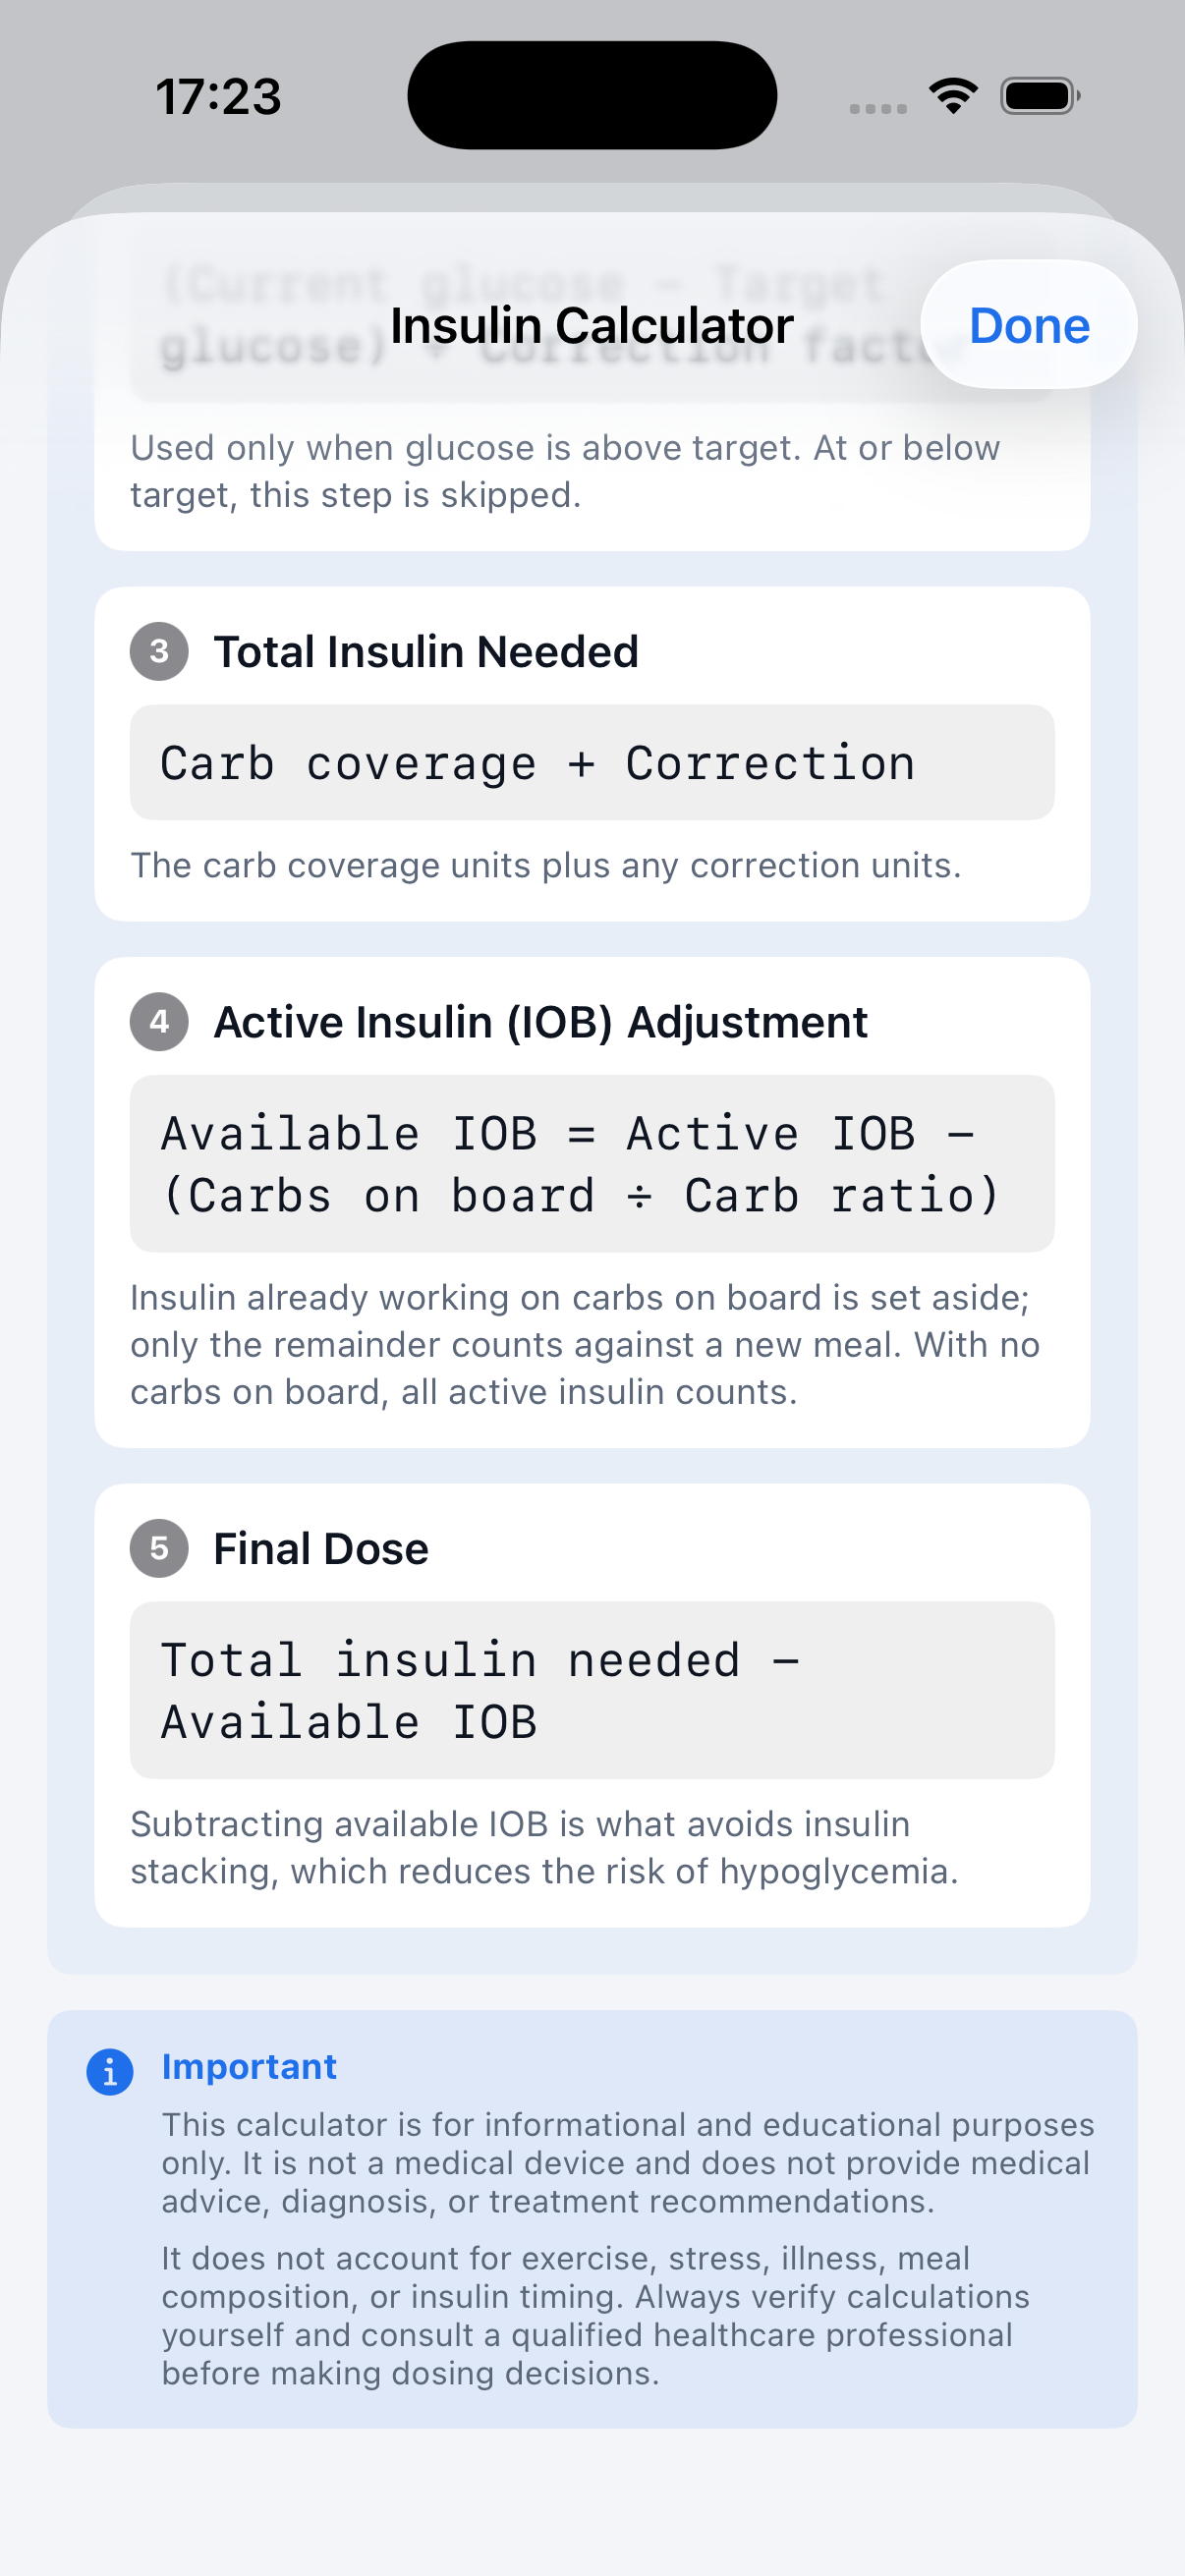
From a food analysis result, tapping Bolus Calculator opens the Insulin Calculator pre-filled with the estimated carbs, current glucose, target glucose, carb ratio, correction factor, active IOB, and carbs on board — all editable before tapping Calculate.
Chapter 10
A plain-language recap of the last 7 days, in four tabs: Summary, Patterns, Therapy, and Days. A one-time medical disclaimer appears the first time you open this screen.
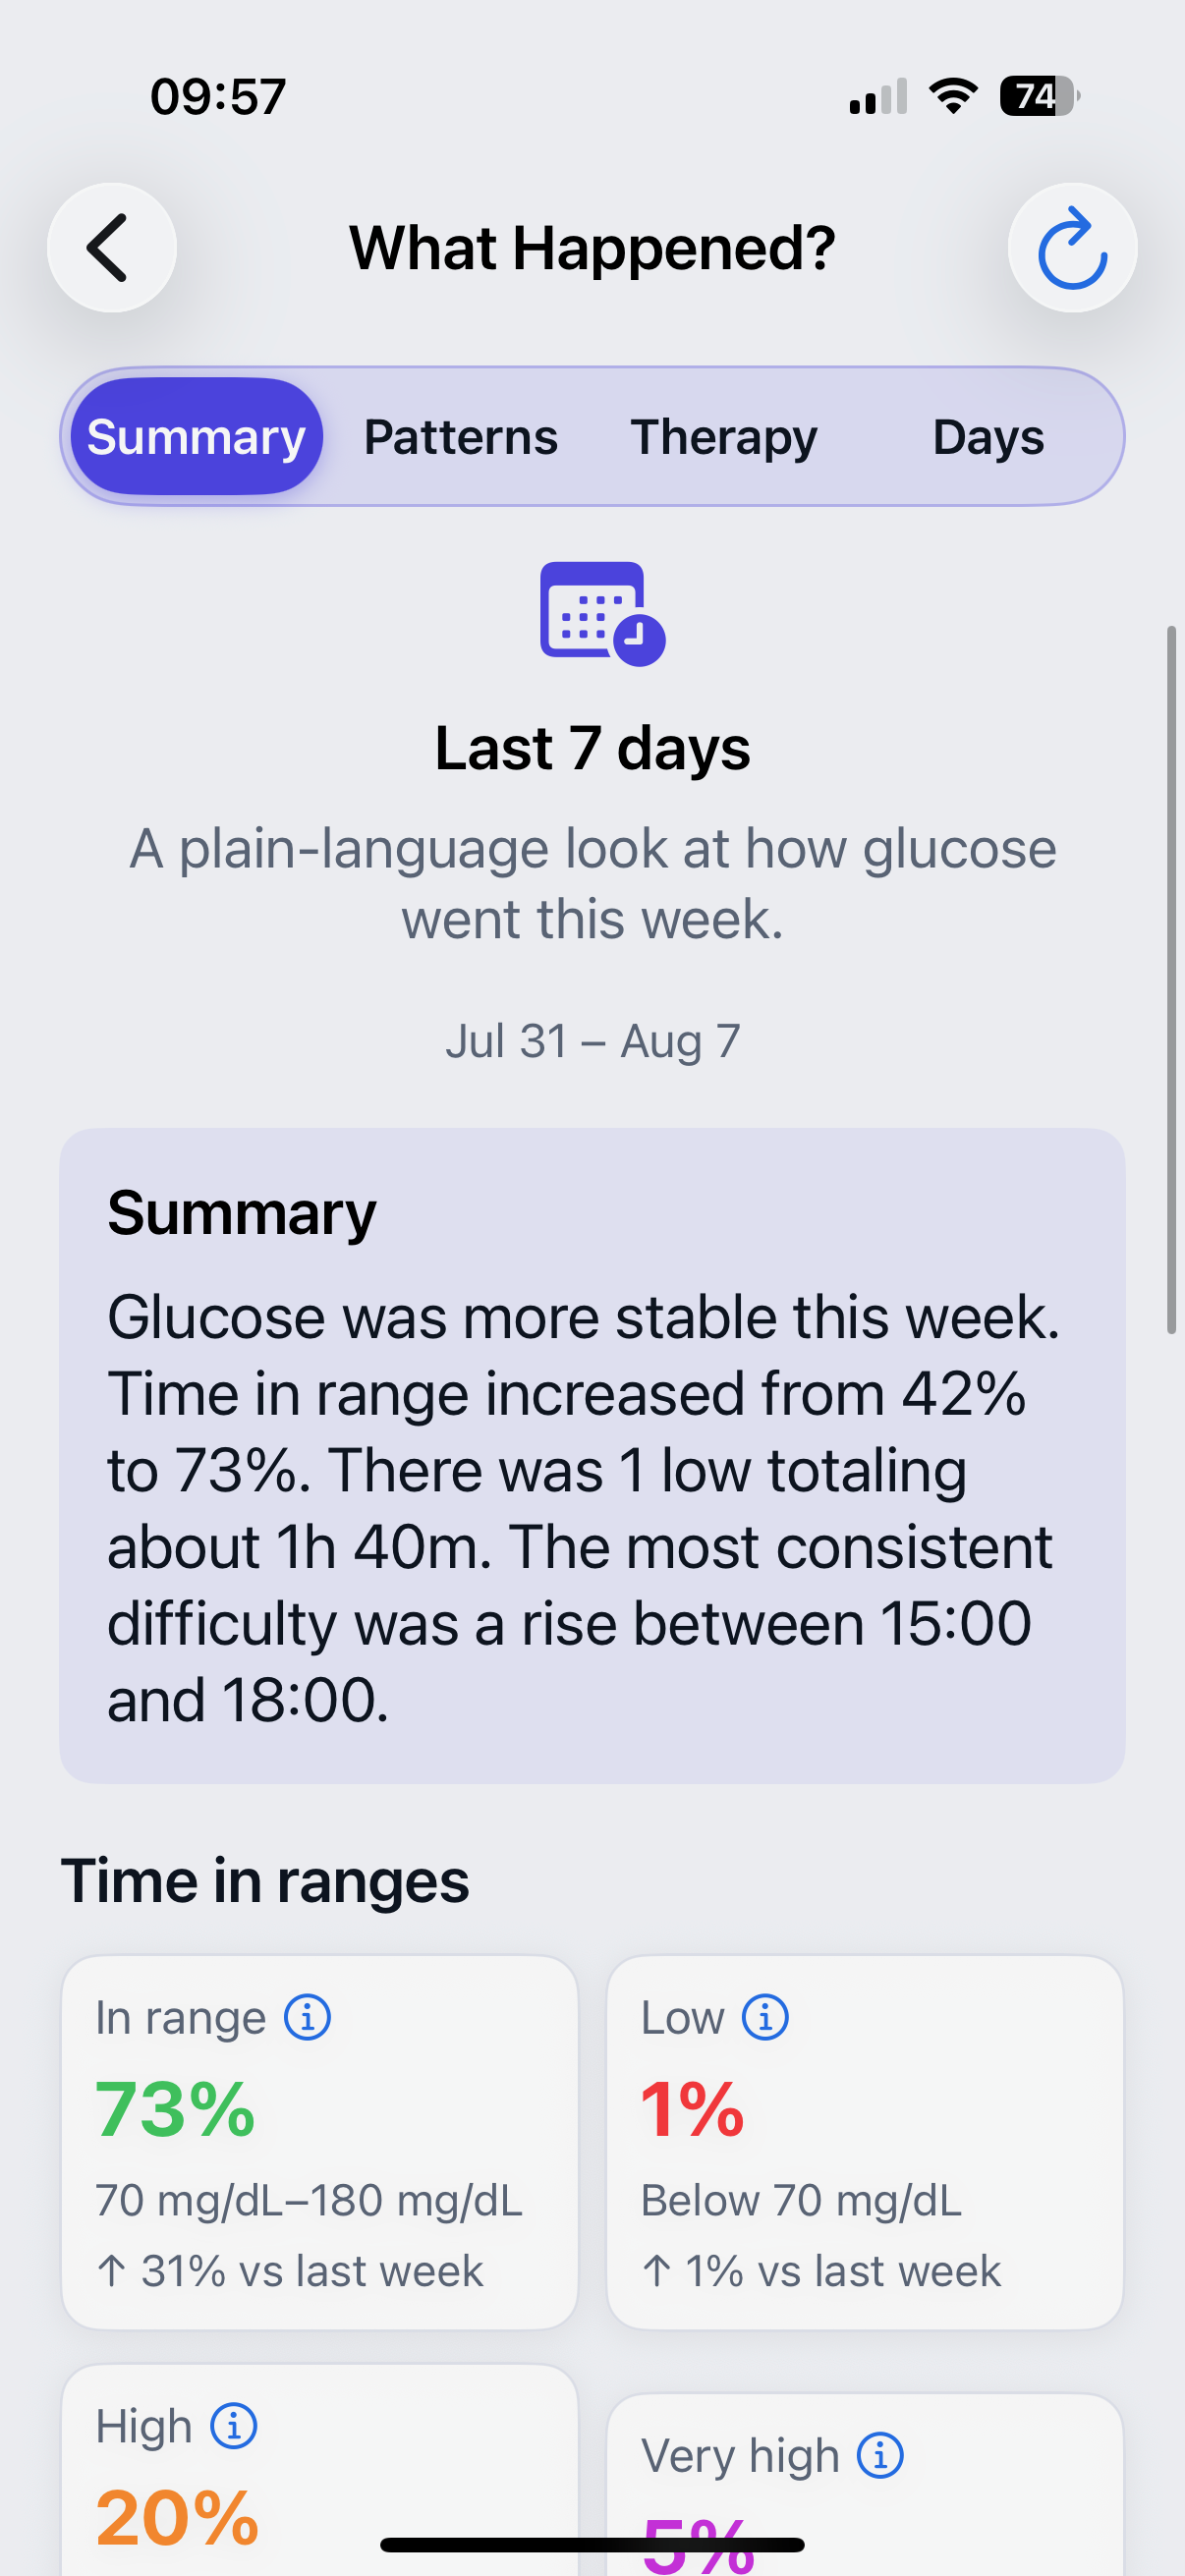
Time-in-range trend compared with the prior week, plus a short narrative describing how the week went overall.
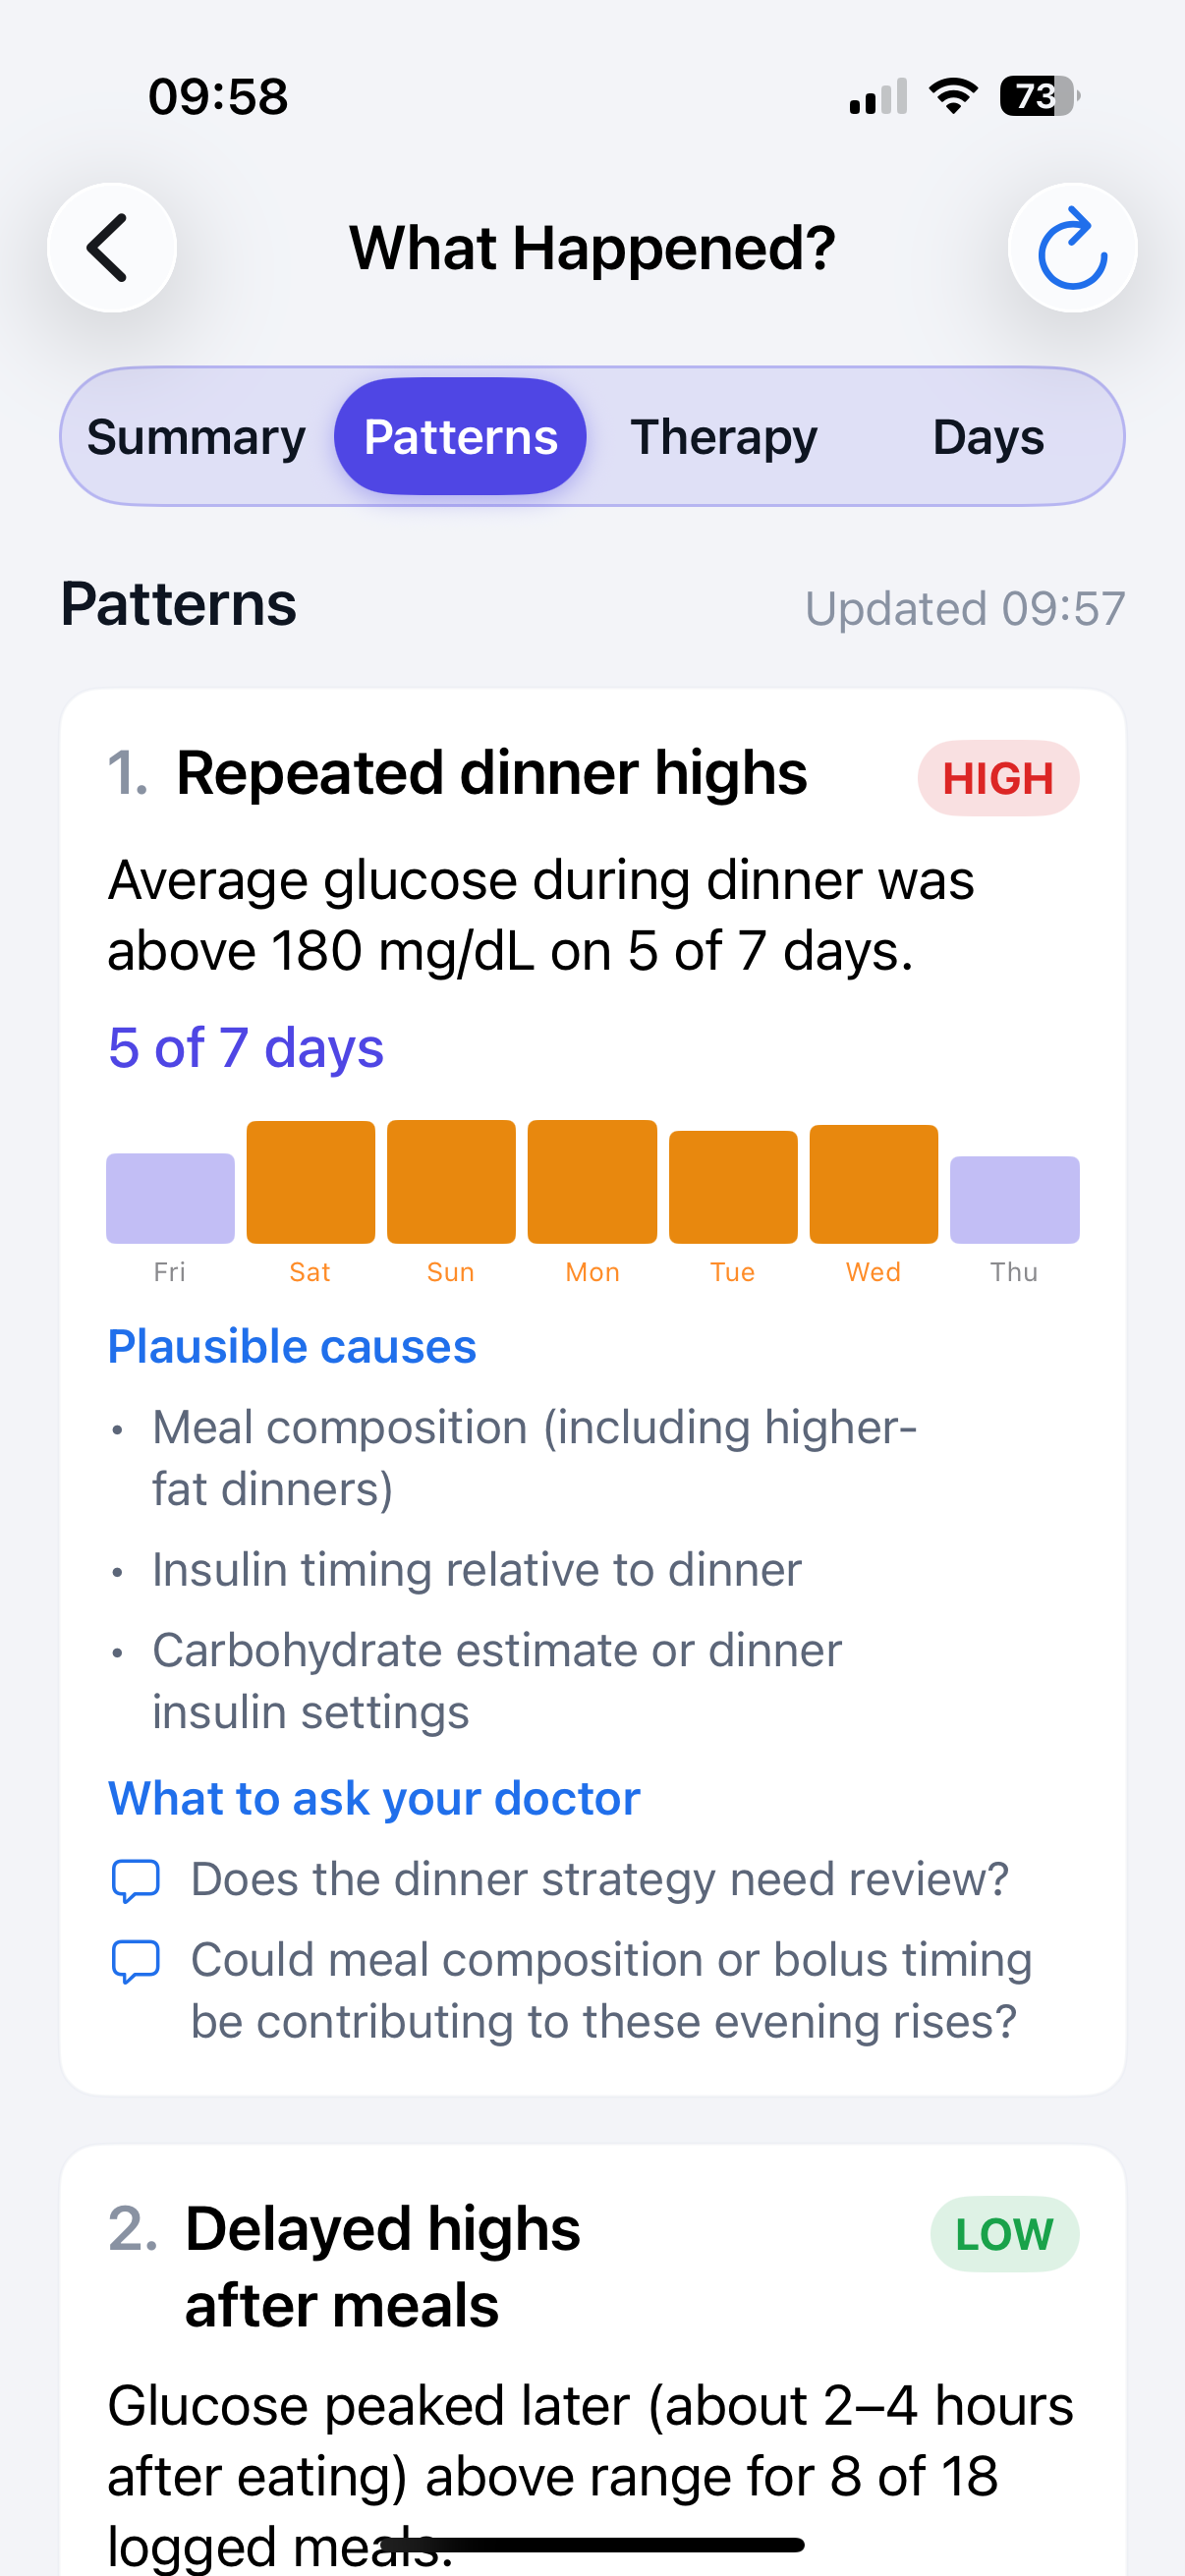
The top repeated glucose patterns of the week (e.g. "Morning highs," "Repeated dinner highs"), each with a day-by-day breakdown chart, possible contributing factors, and questions for your care team. Below the patterns, a Food, exercise & timing context section adds AI-reviewed observations that may help explain them — repeated meals, activity, or logging timing — each with supporting evidence and a "watch next" suggestion, plus a short checklist of things worth verifying. This context is kept intentionally separate from therapy-setting proposals; it never implies a setting should change.
A review of whether your basal rate, insulin-to-carb ratio, or correction factor may have played a part in how the week went. Your insulin settings lists anything worth raising as a short, tappable row — tap one to open its own screen with the current vs. suggested value, a plain-English explanation of the change, why it came up, how strong the supporting evidence is, a note on how the review was produced, context to check, caveats, and a ready-made question to bring to your care team. When nothing in the week cleared the evidence and safety thresholds, the tab says so plainly rather than forcing a suggestion.
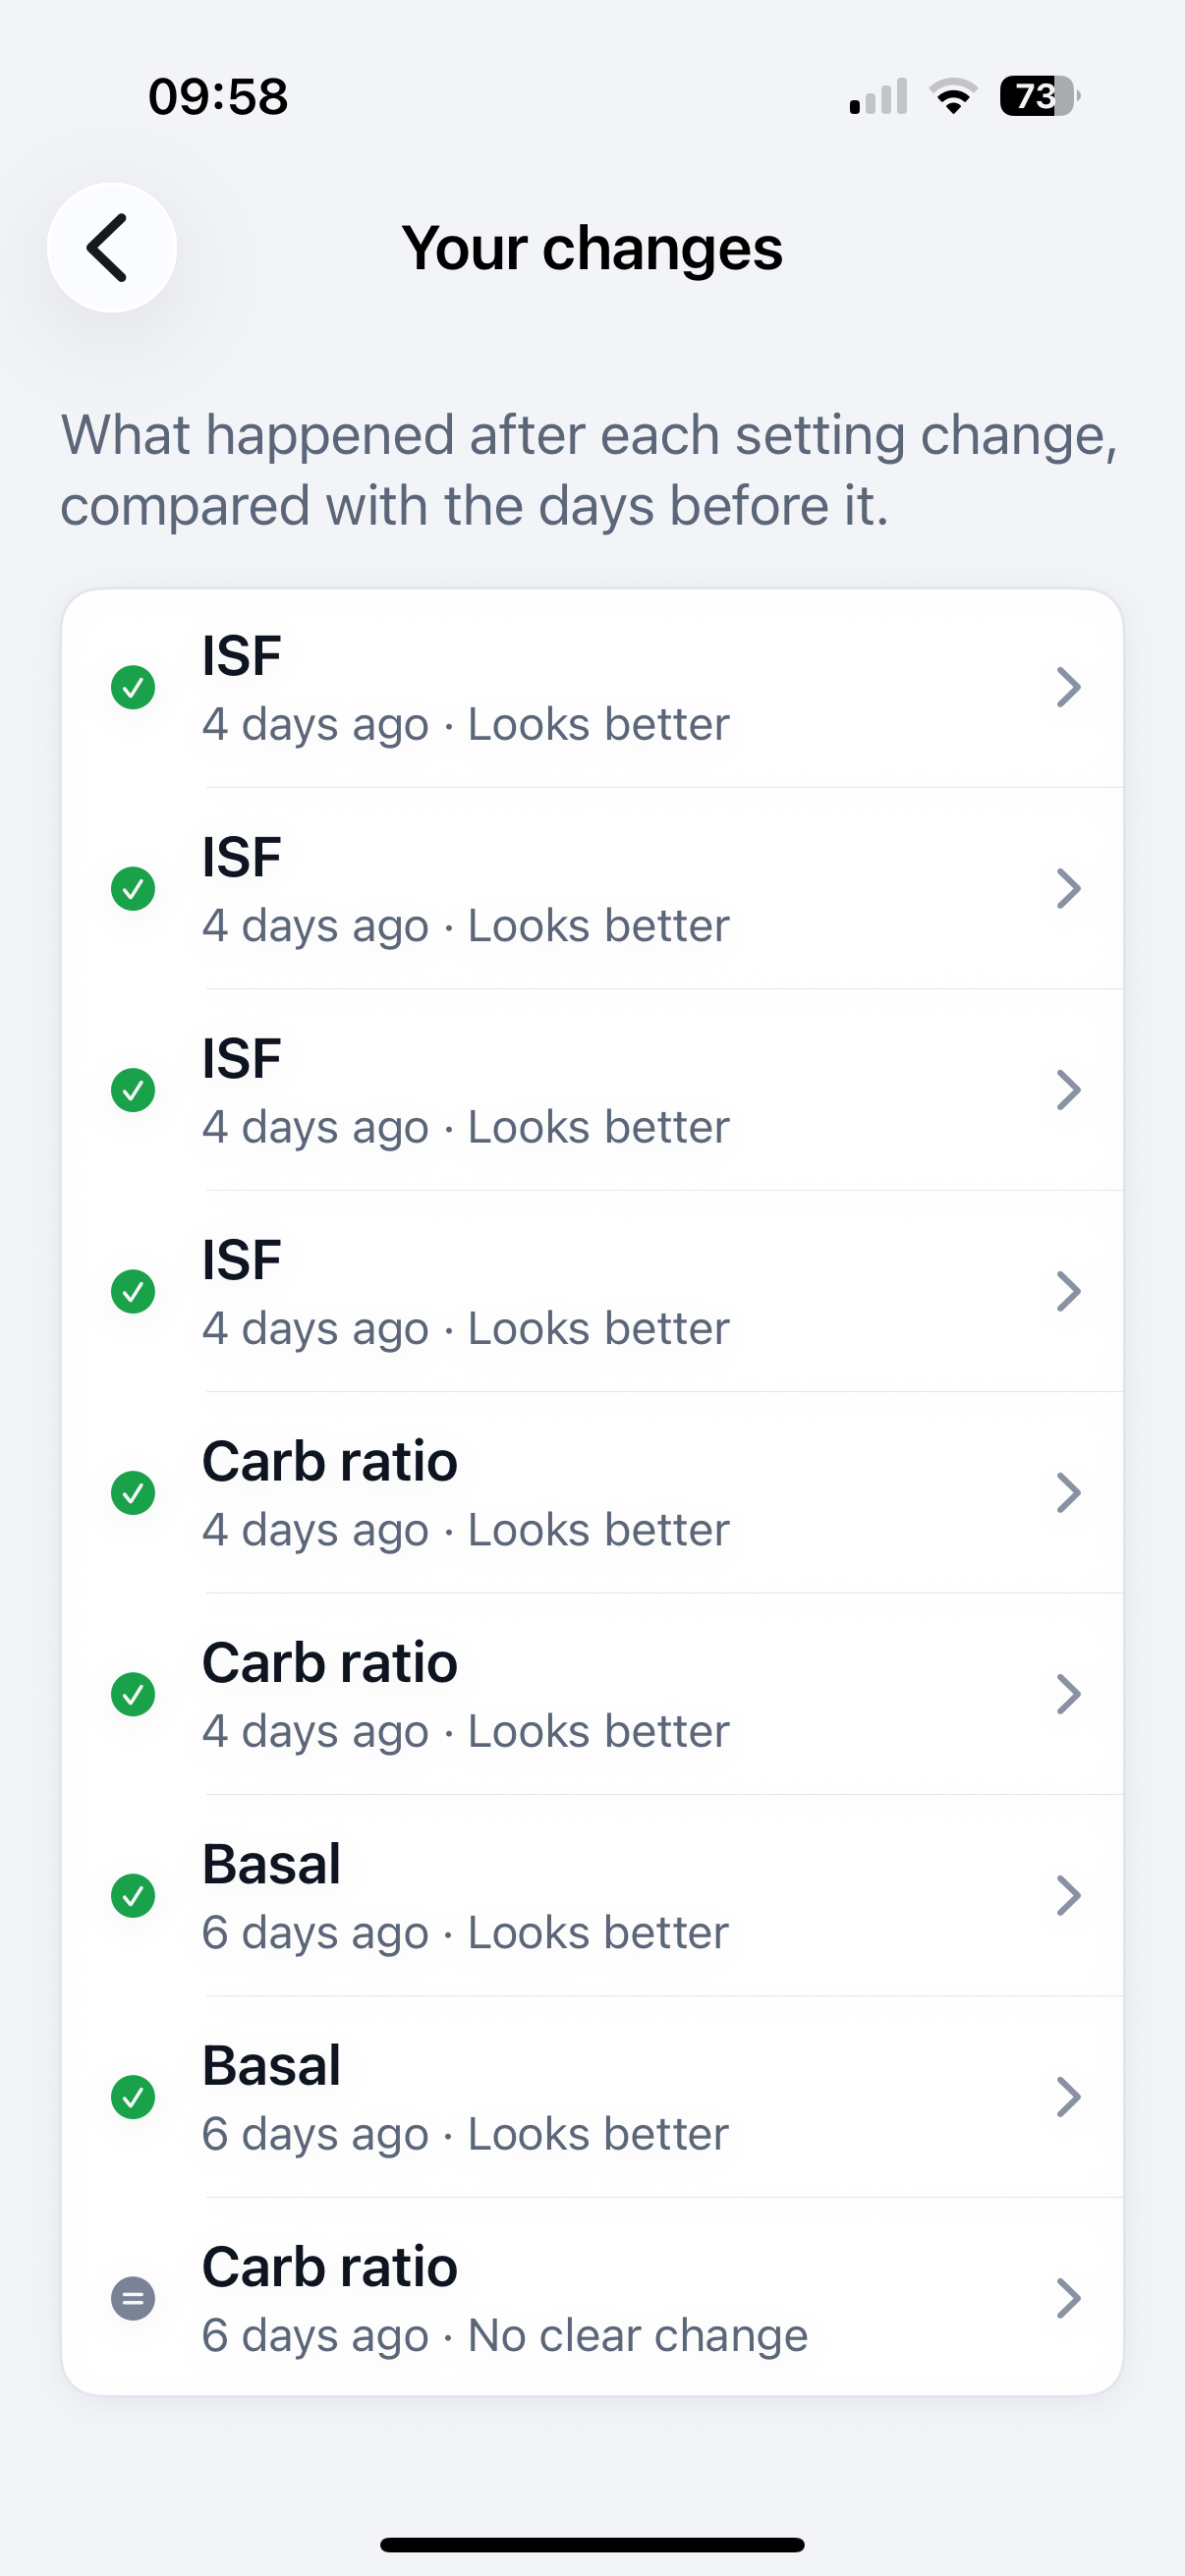
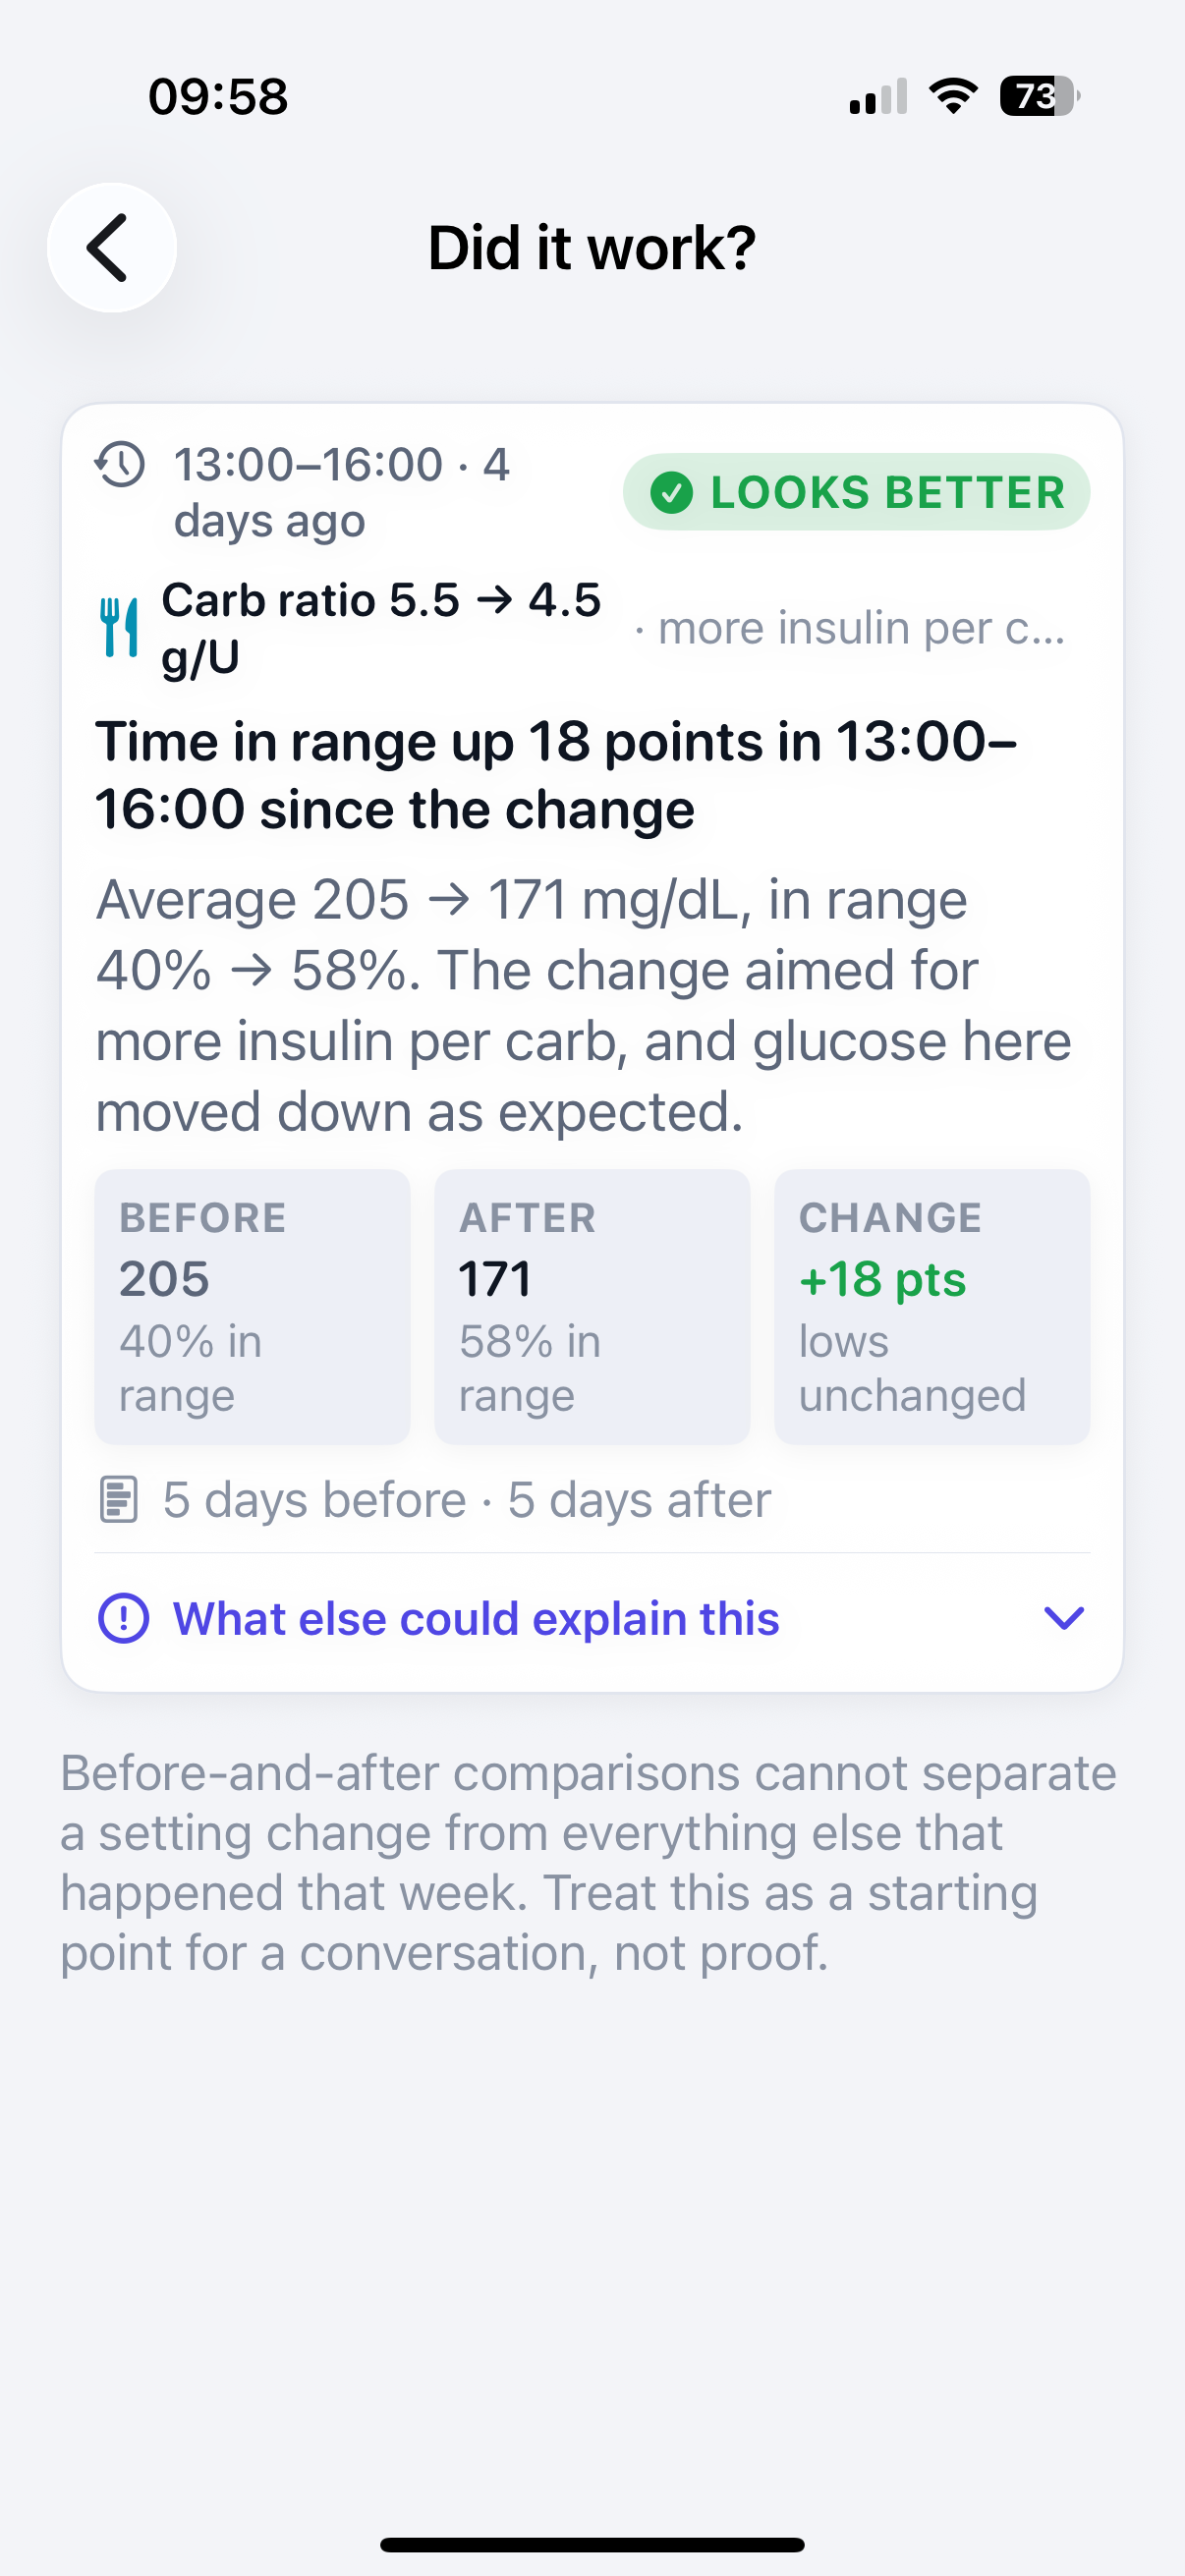
Your changes answers a different question: for any therapy adjustment the app has already seen you make, did it help? A single tile summarizes the verdict (Improved, Worse, Unchanged, Too early, or Not enough data yet) for the most recent change — tap it for the full before-and-after list.
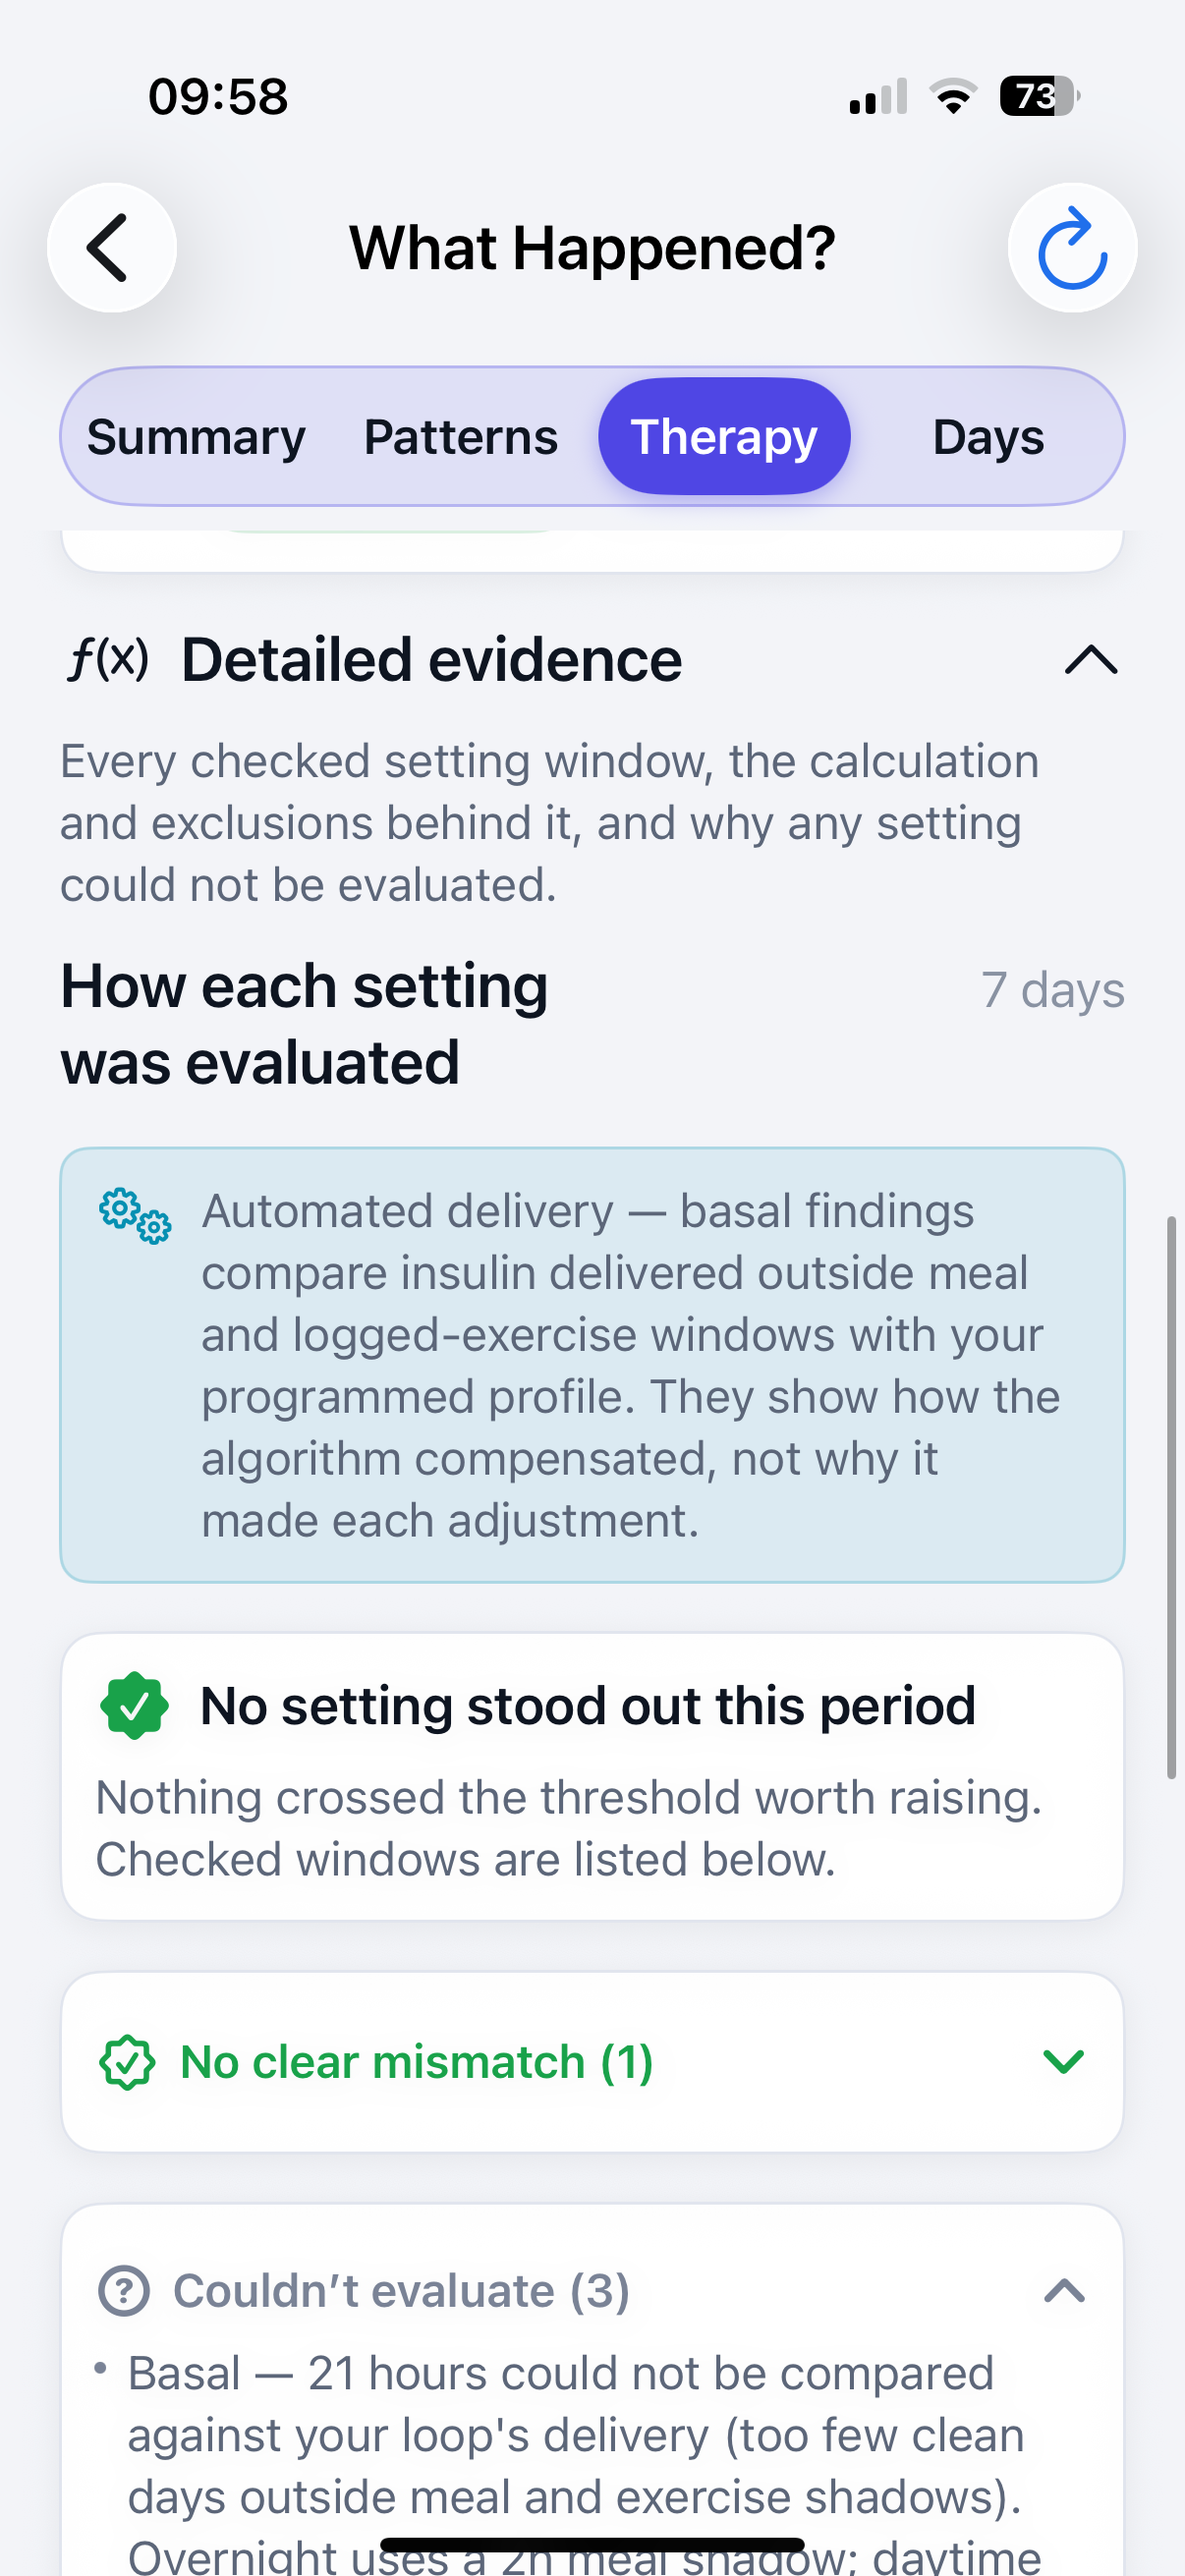
The review always runs as a deterministic Formula pass (free, unlimited); when AI enrichment is available it adds context on top rather than replacing the formula's numbers — the app's numeric proposals are never AI-generated. Turning on Advanced details in Settings → Reports also reveals a Detailed evidence section here, listing every setting window the app checked, the calculation behind it, and why any setting could not be evaluated.
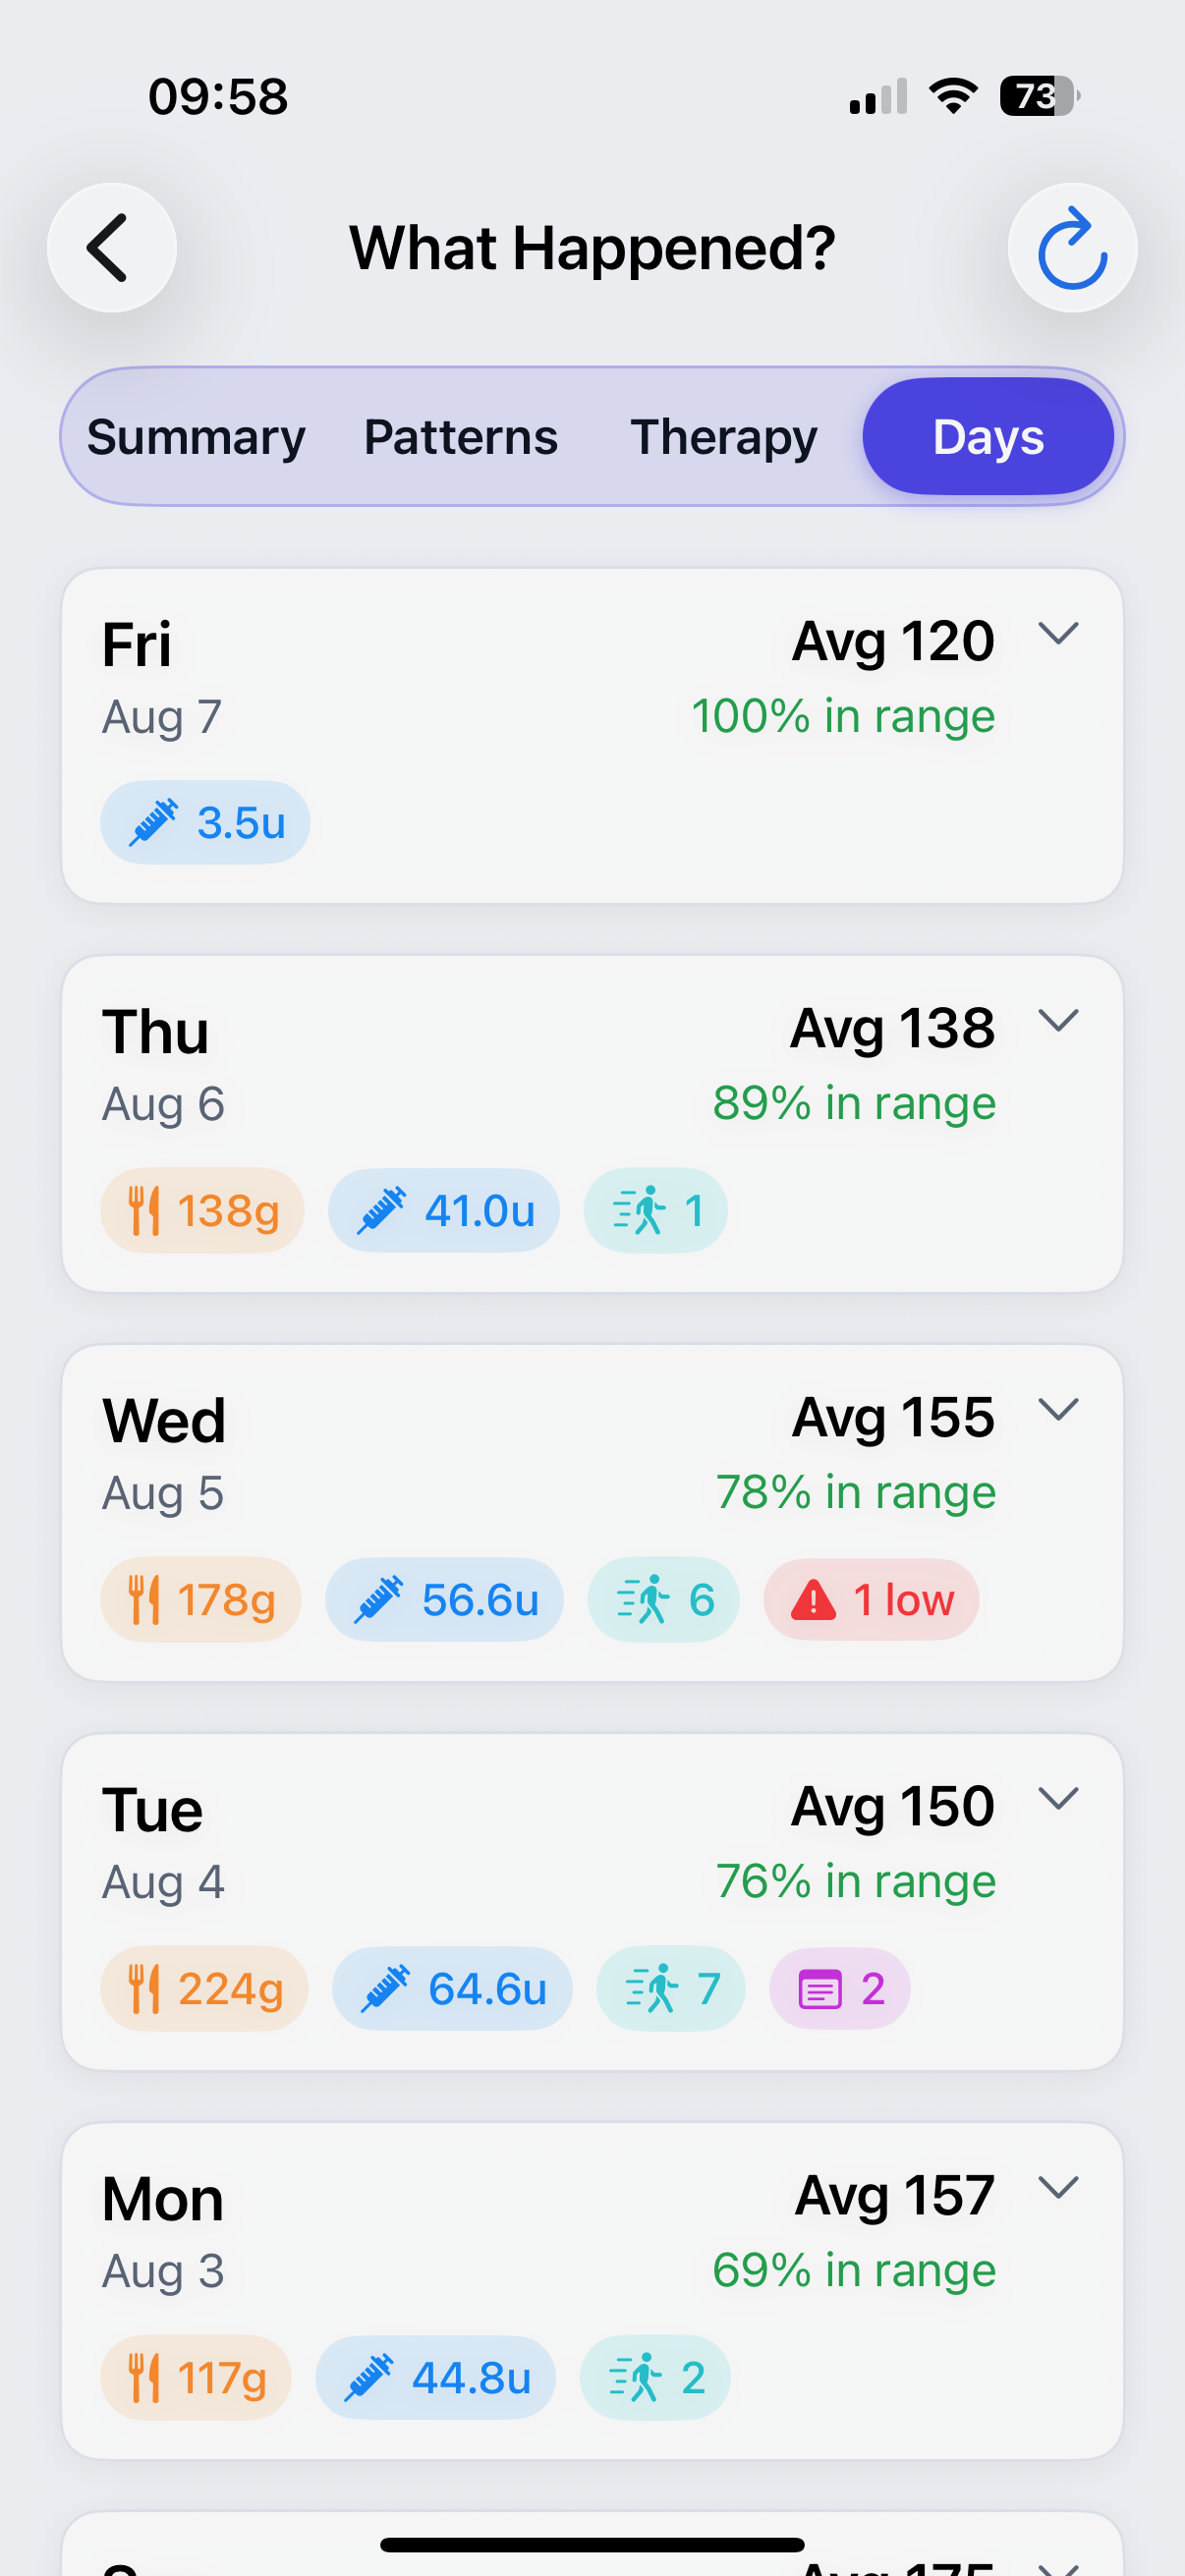
Day-by-day detail for the full week — meals, boluses, and a summary line per day; tap a day to expand it.
Chapter 11
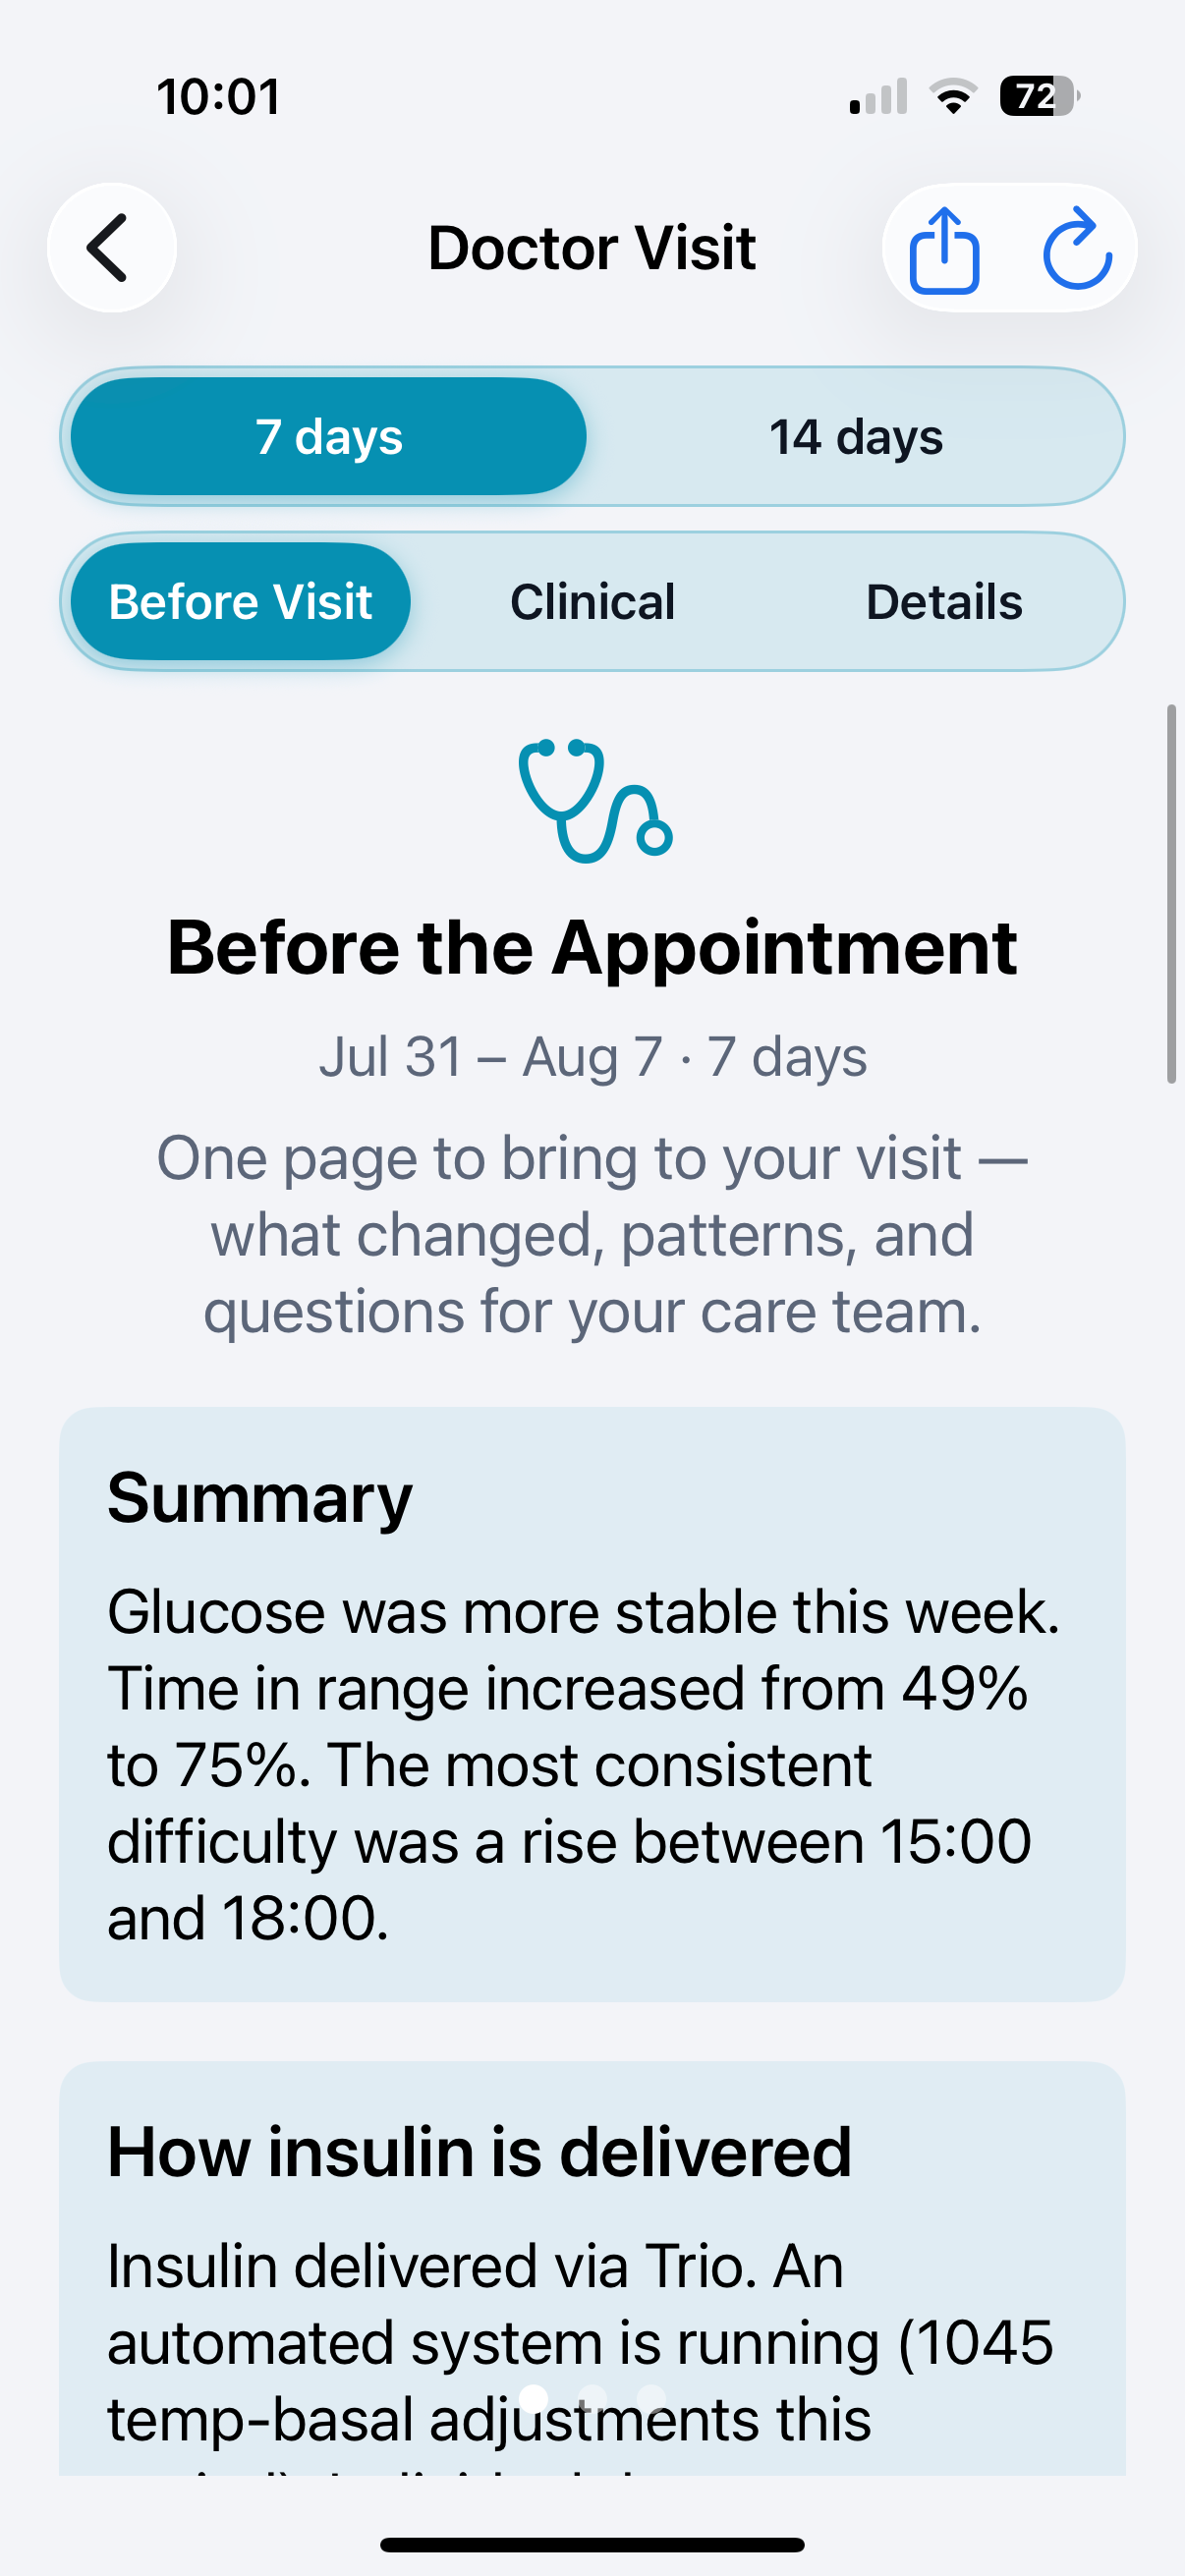
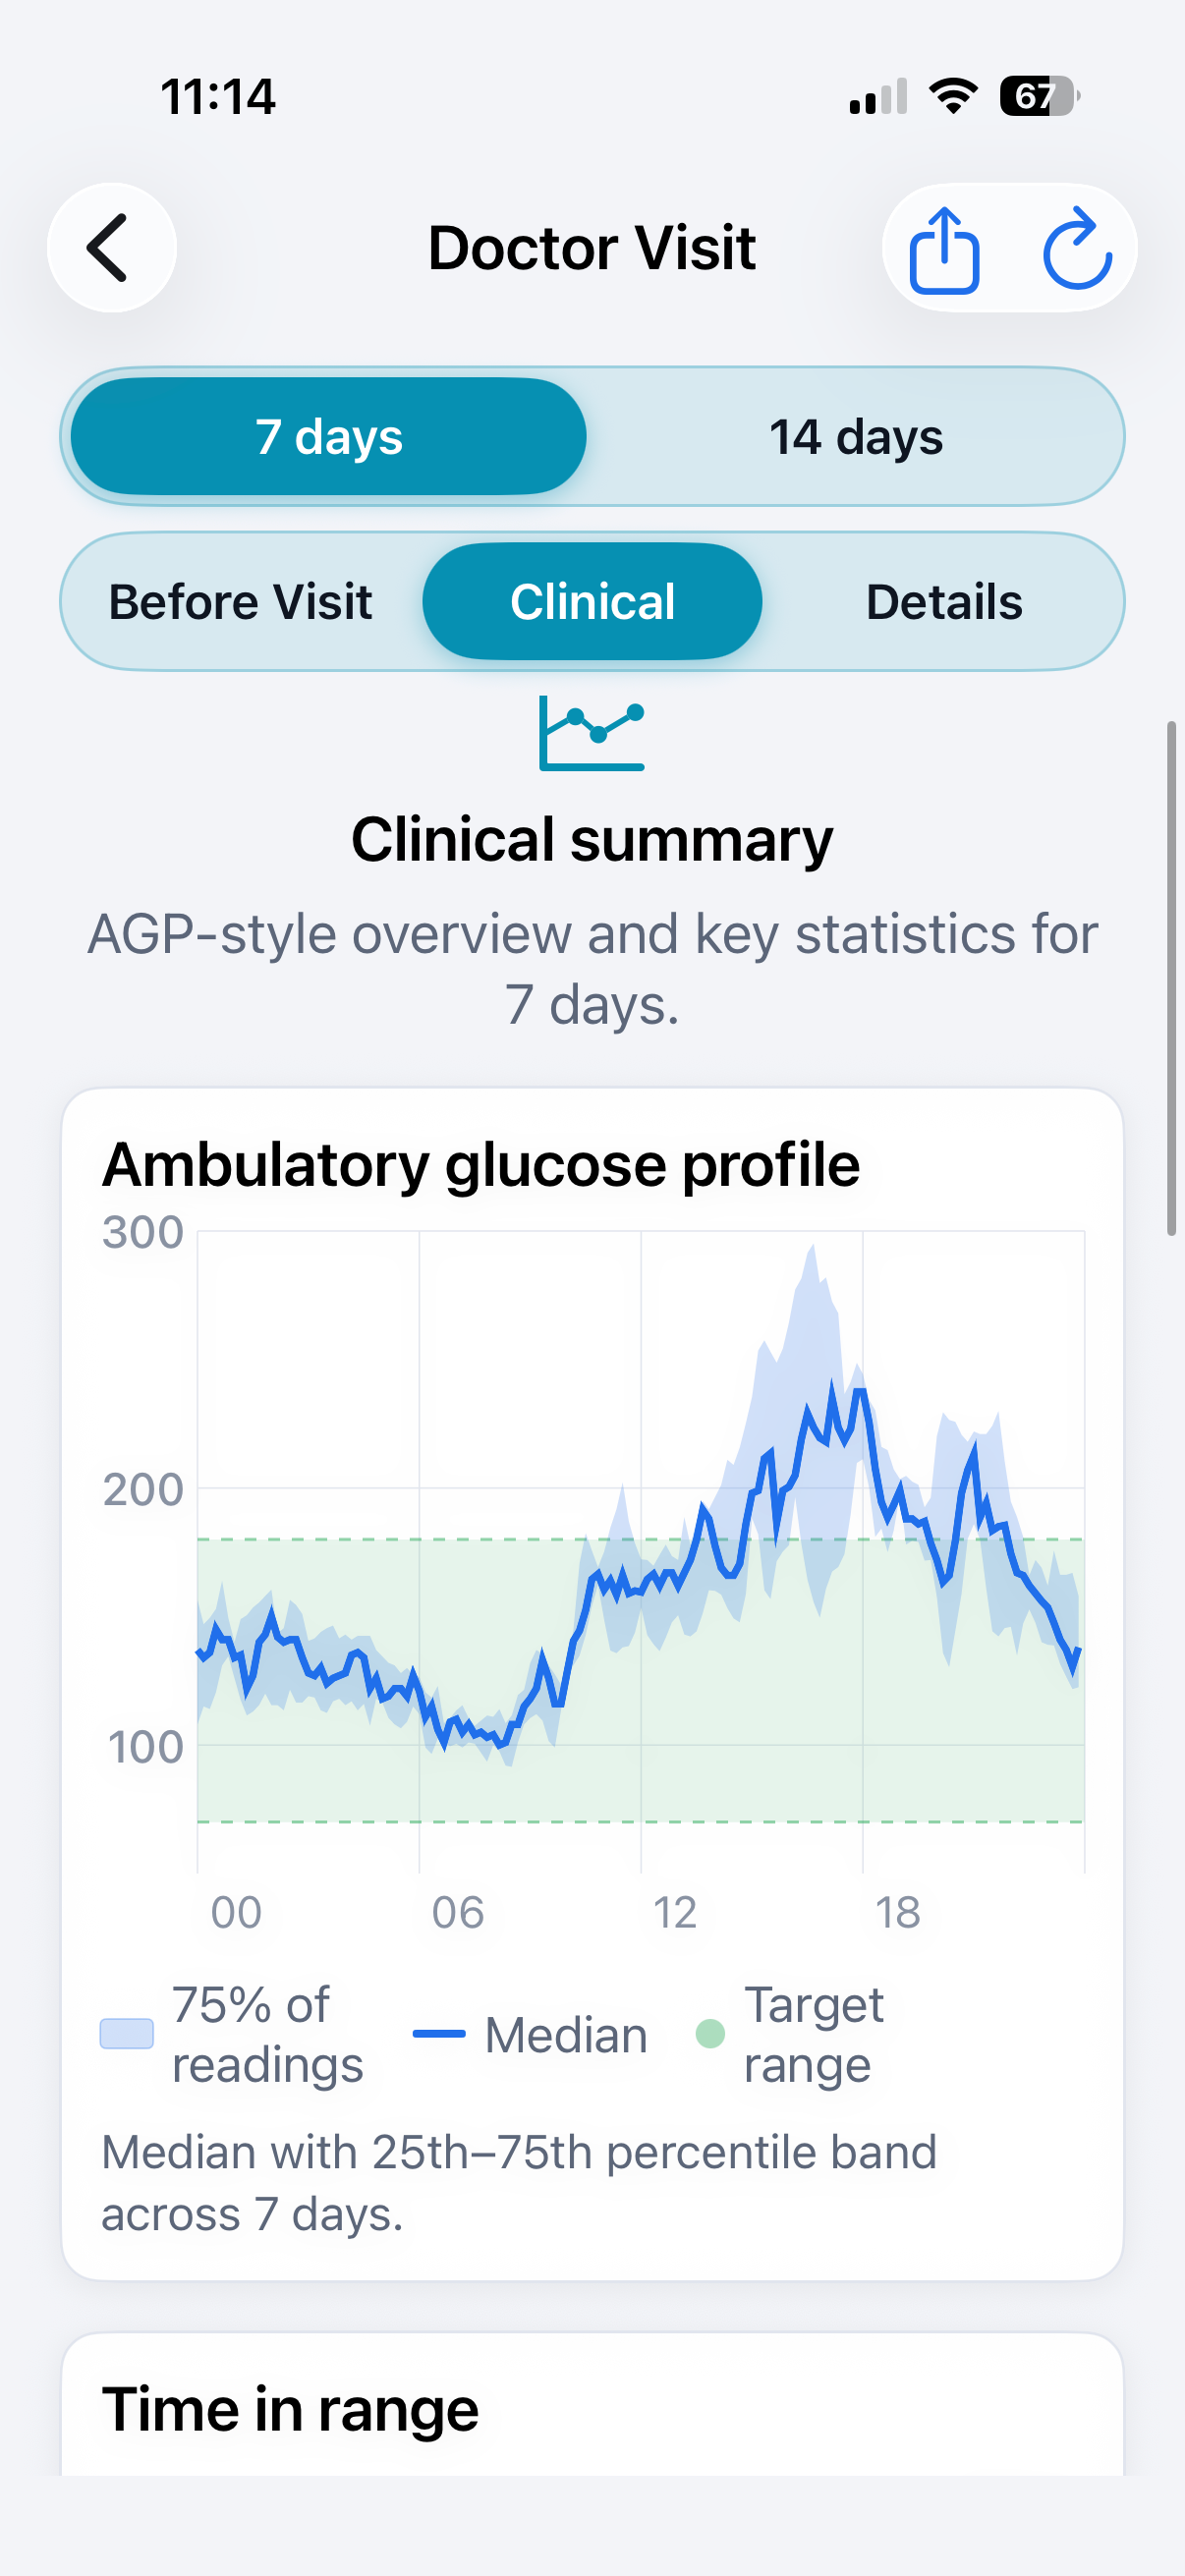
Prepares a one-page report for appointments, over a 7 or 14-day window, across three tabs: Before Visit (what changed since your last appointment plus detected patterns), Clinical (an AGP-style ambulatory glucose profile chart and time-in-range statistics), and Details. Use the share icon in the top-right to export the report.
Chapter 12
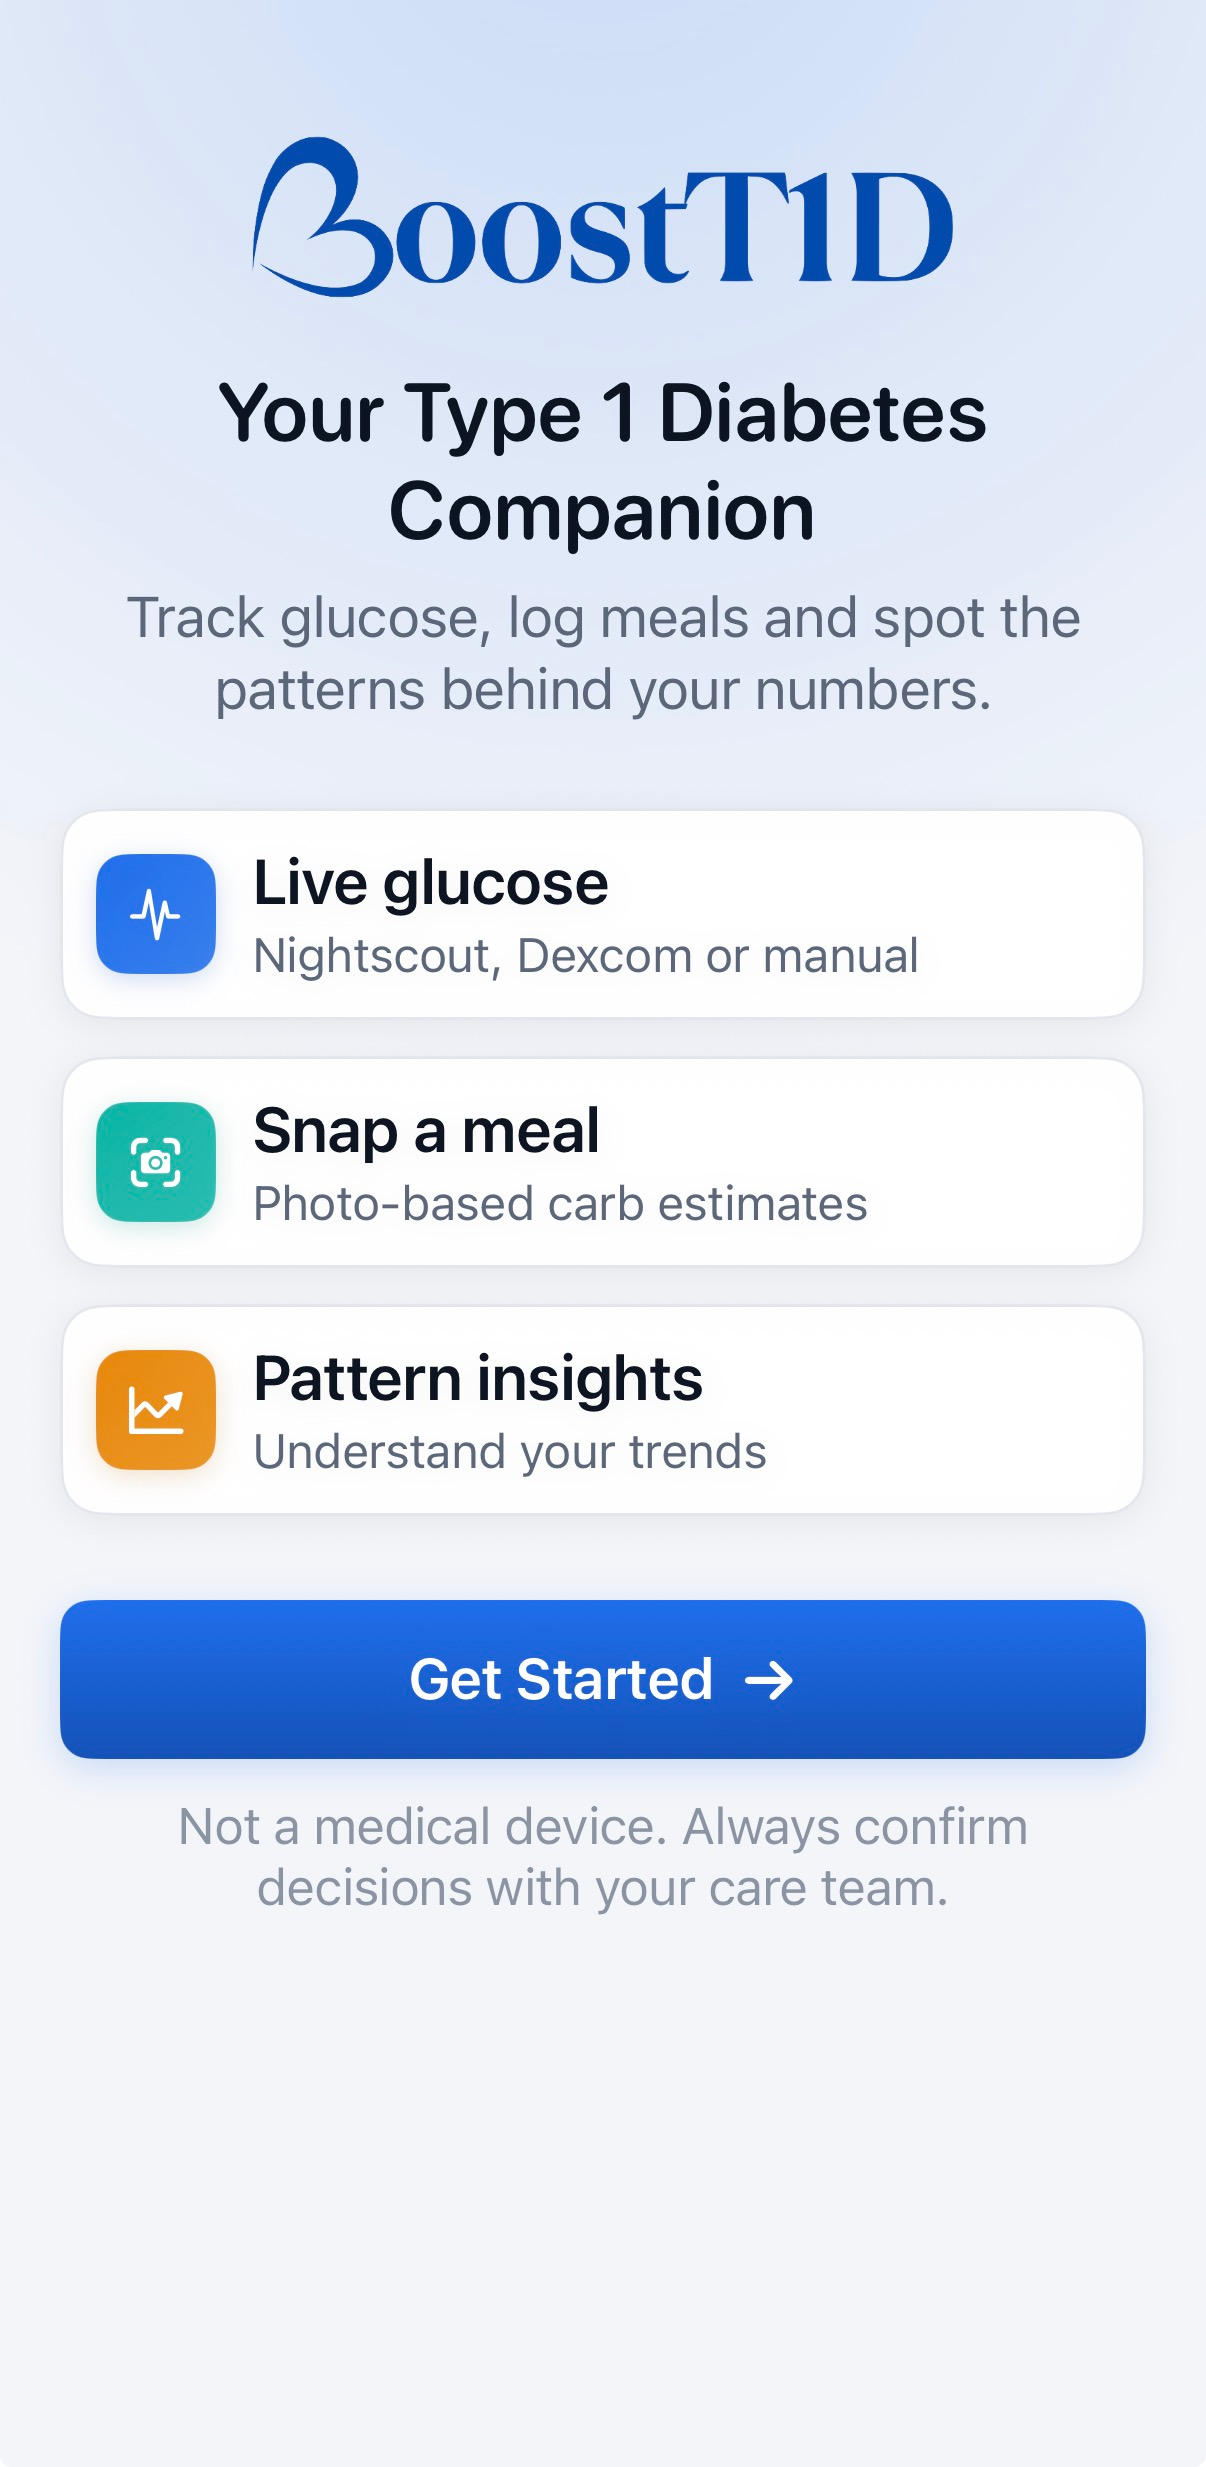
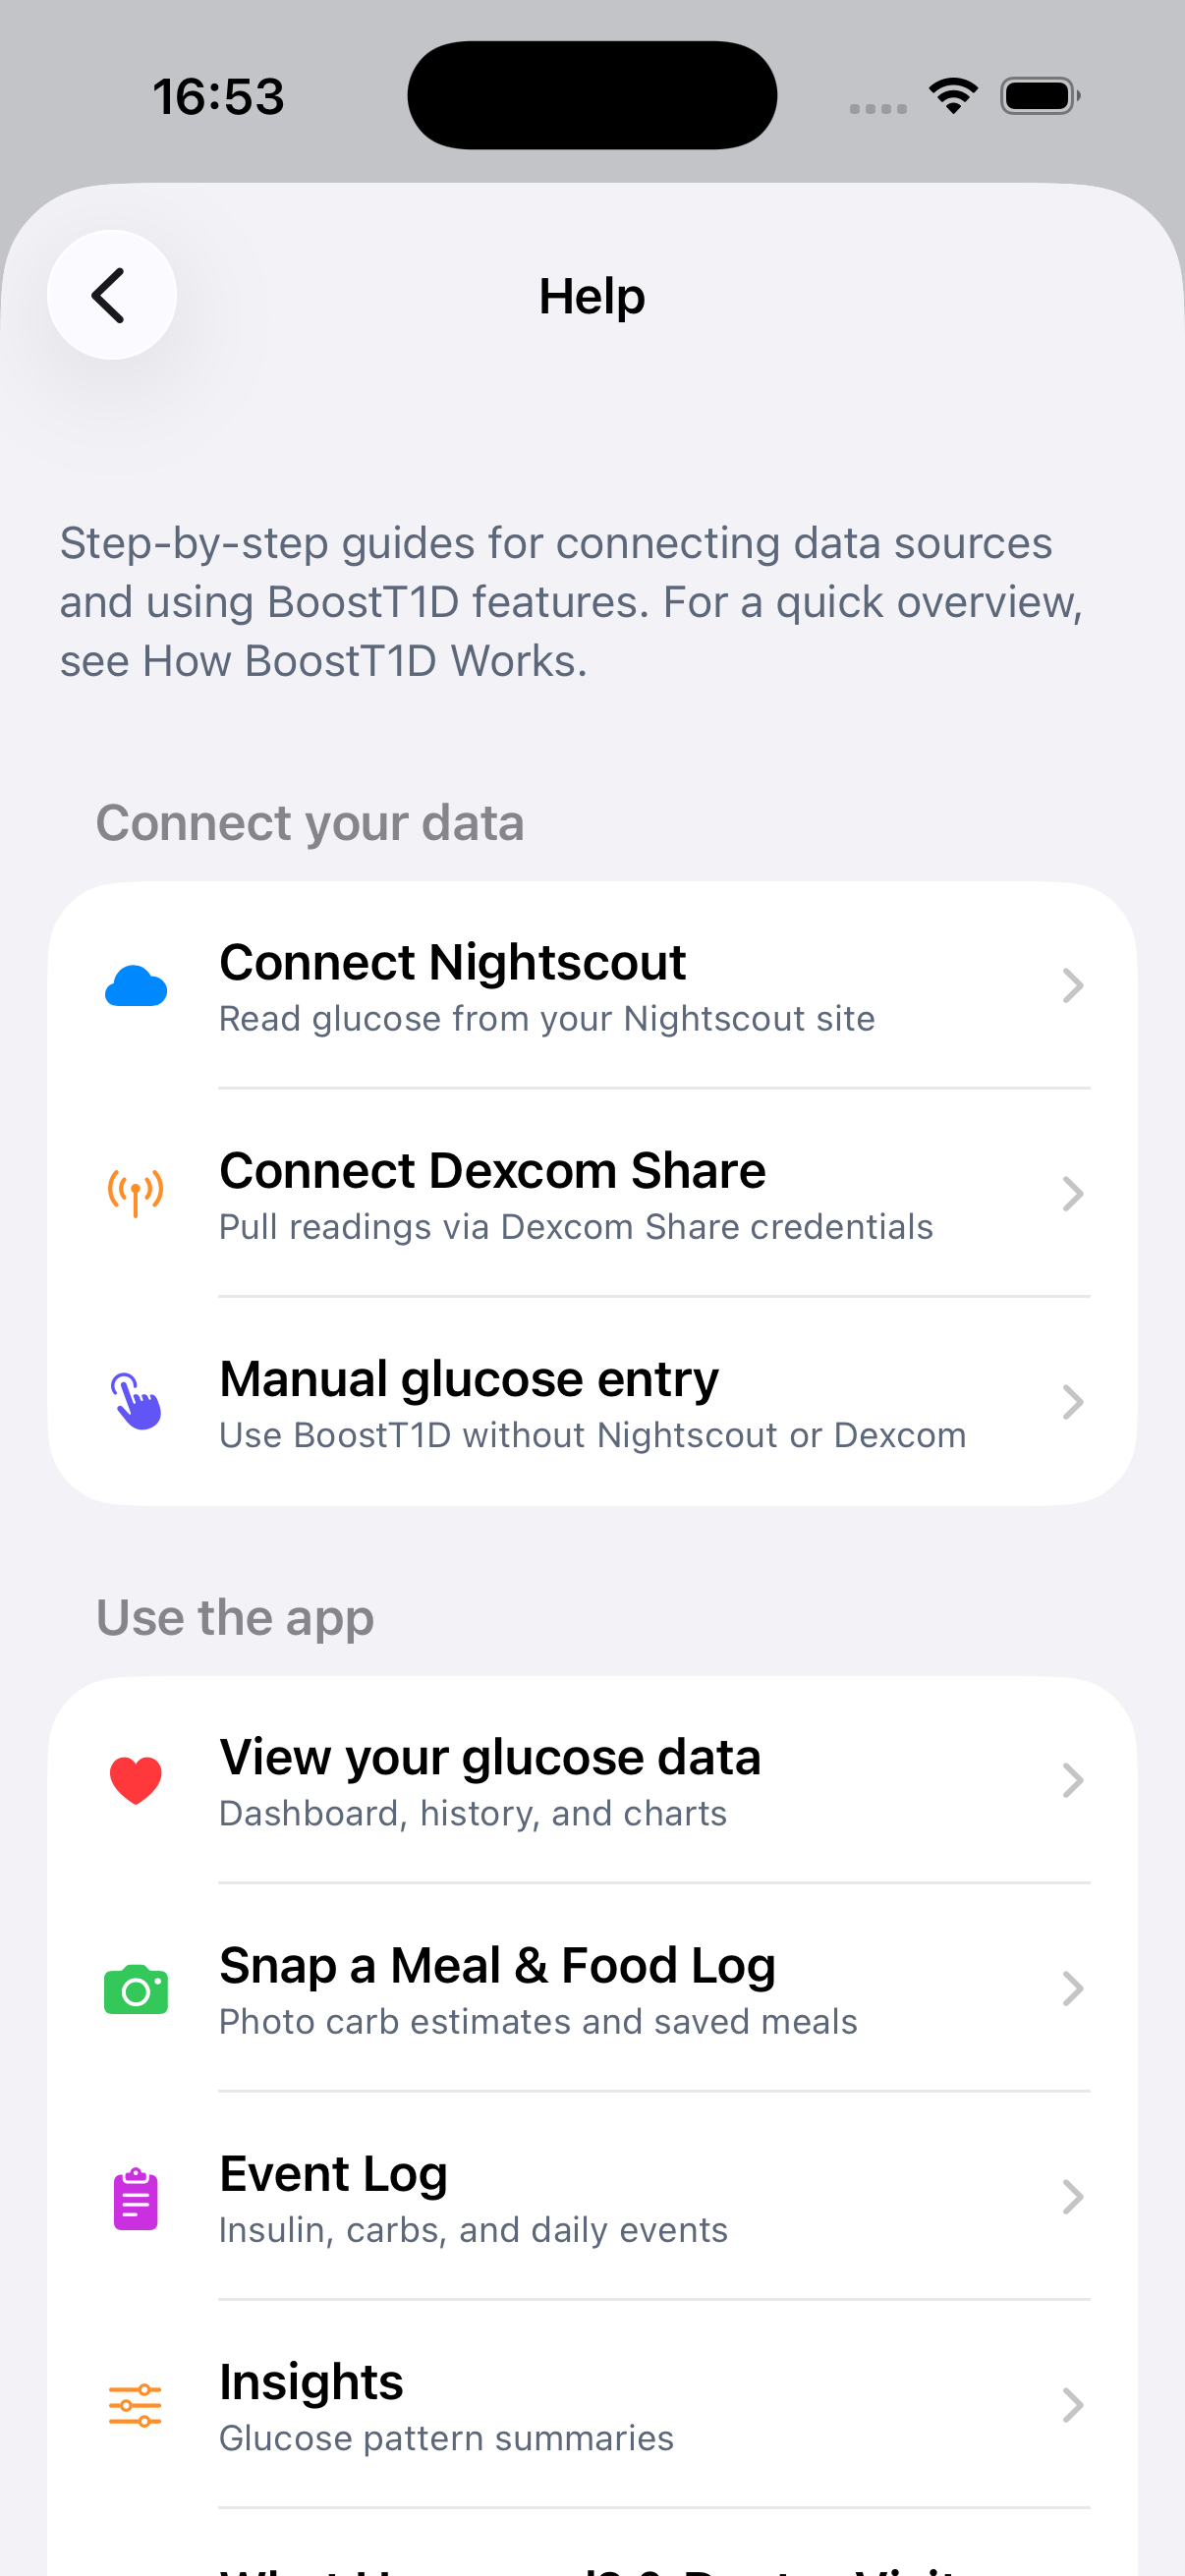
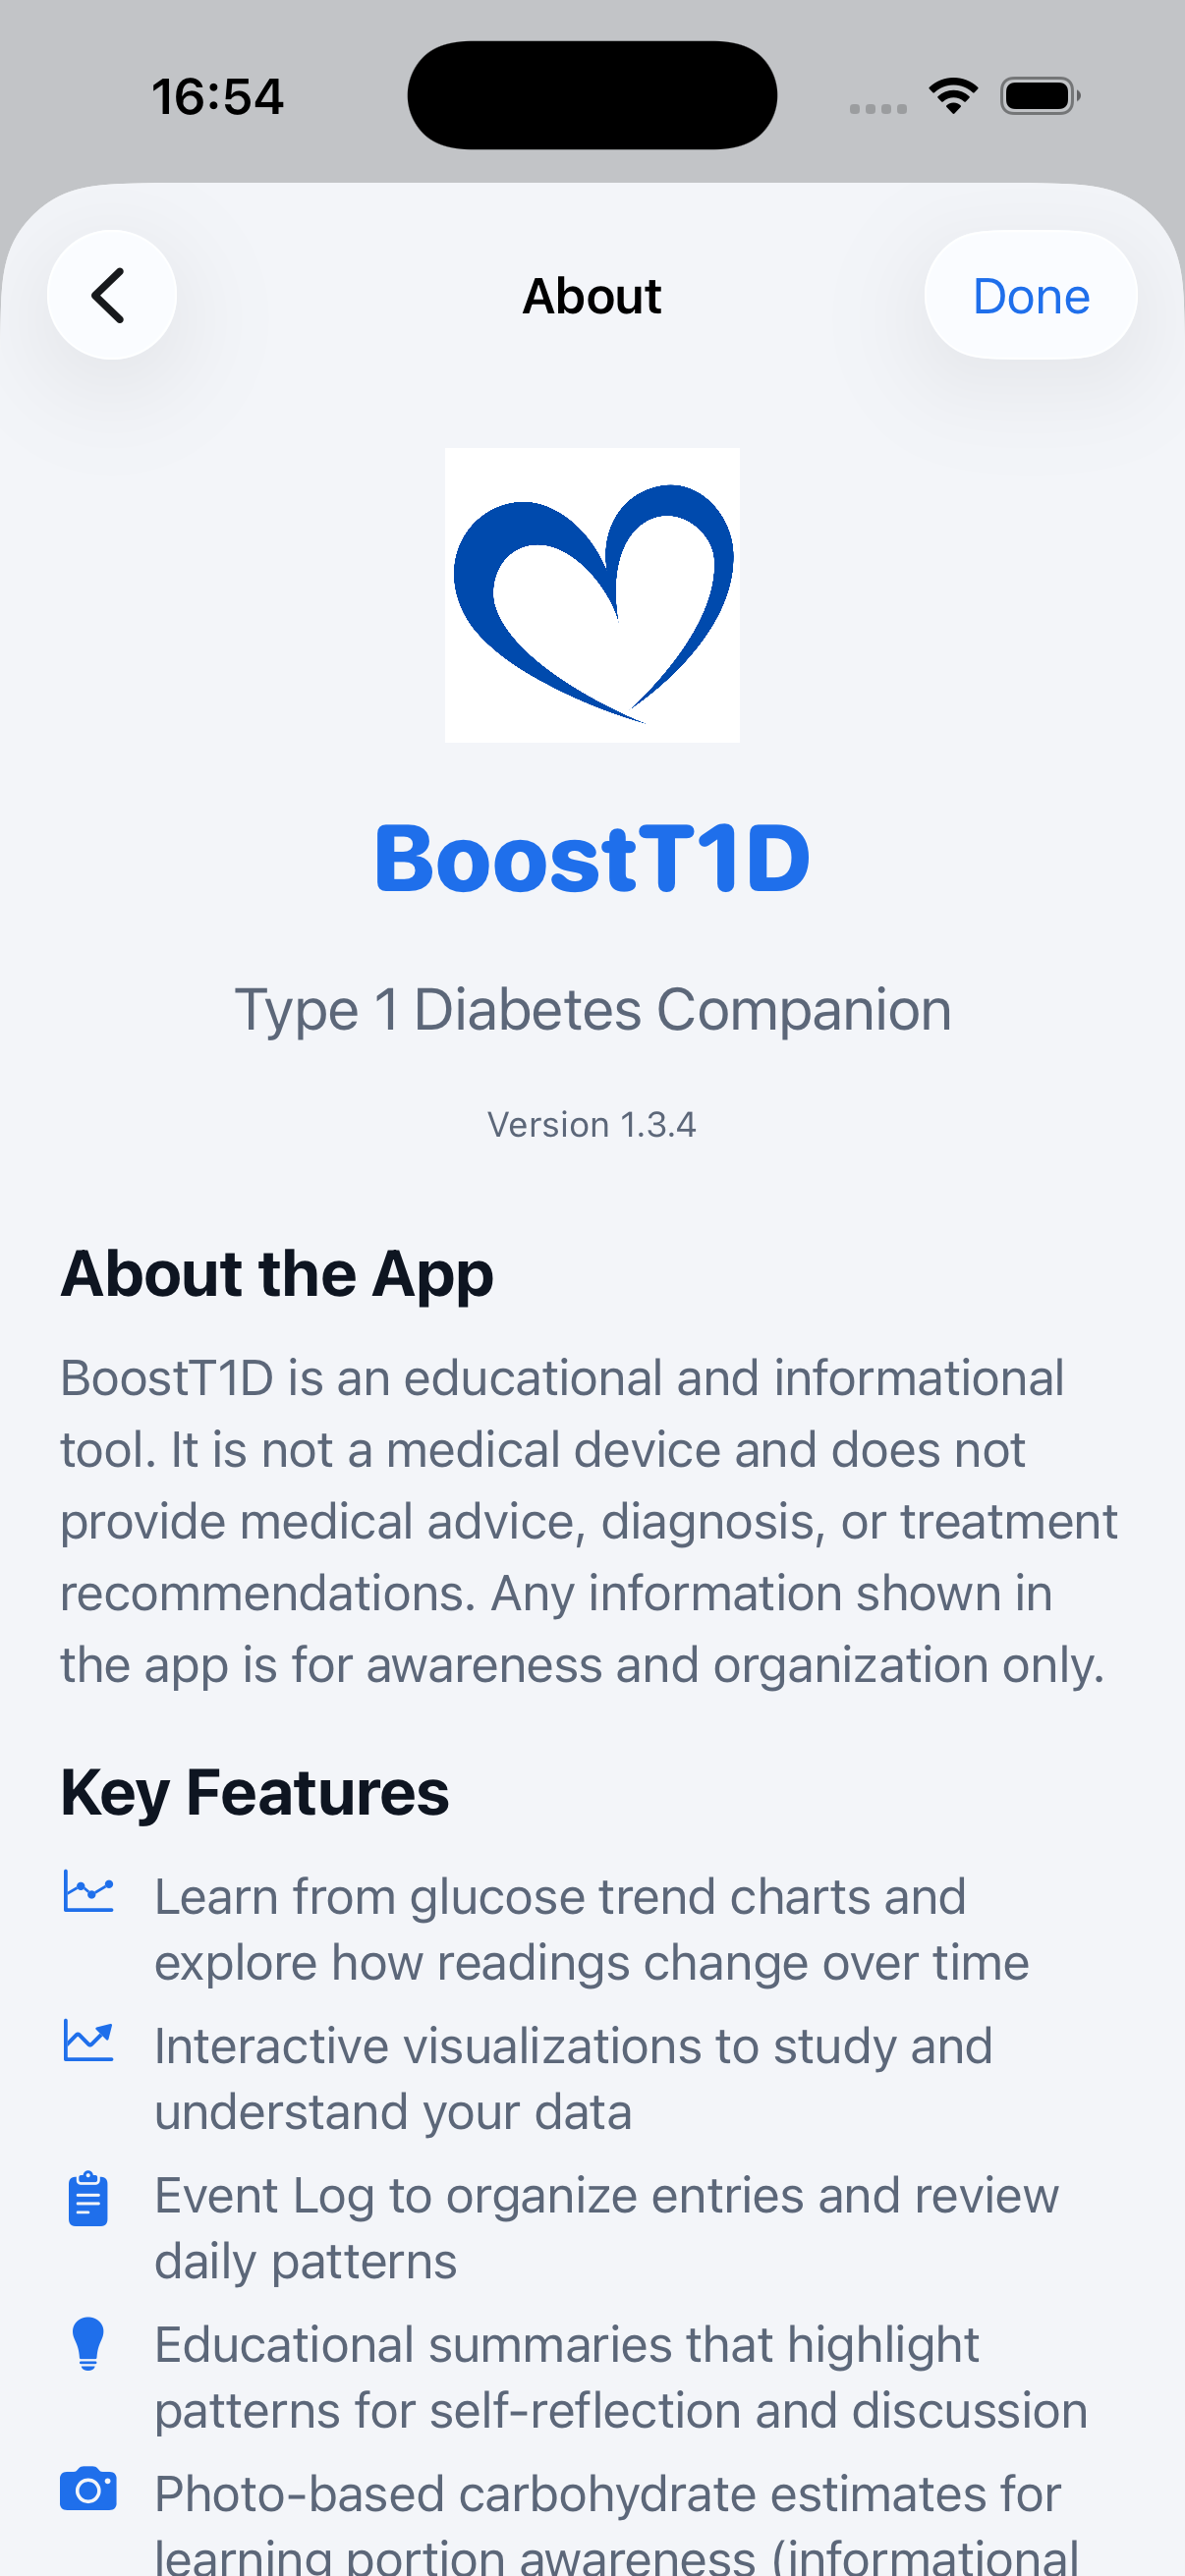
How BoostT1D Works is a guided tour shown automatically on first launch and replayable anytime from All Tools → About → How It Works. Help holds step-by-step setup guides (Connect Nightscout, Connect Dexcom Share, Connect LibreLinkUp, Manual glucose entry) plus feature guides. About shows the app version, purpose, and key features.
Chapter 13
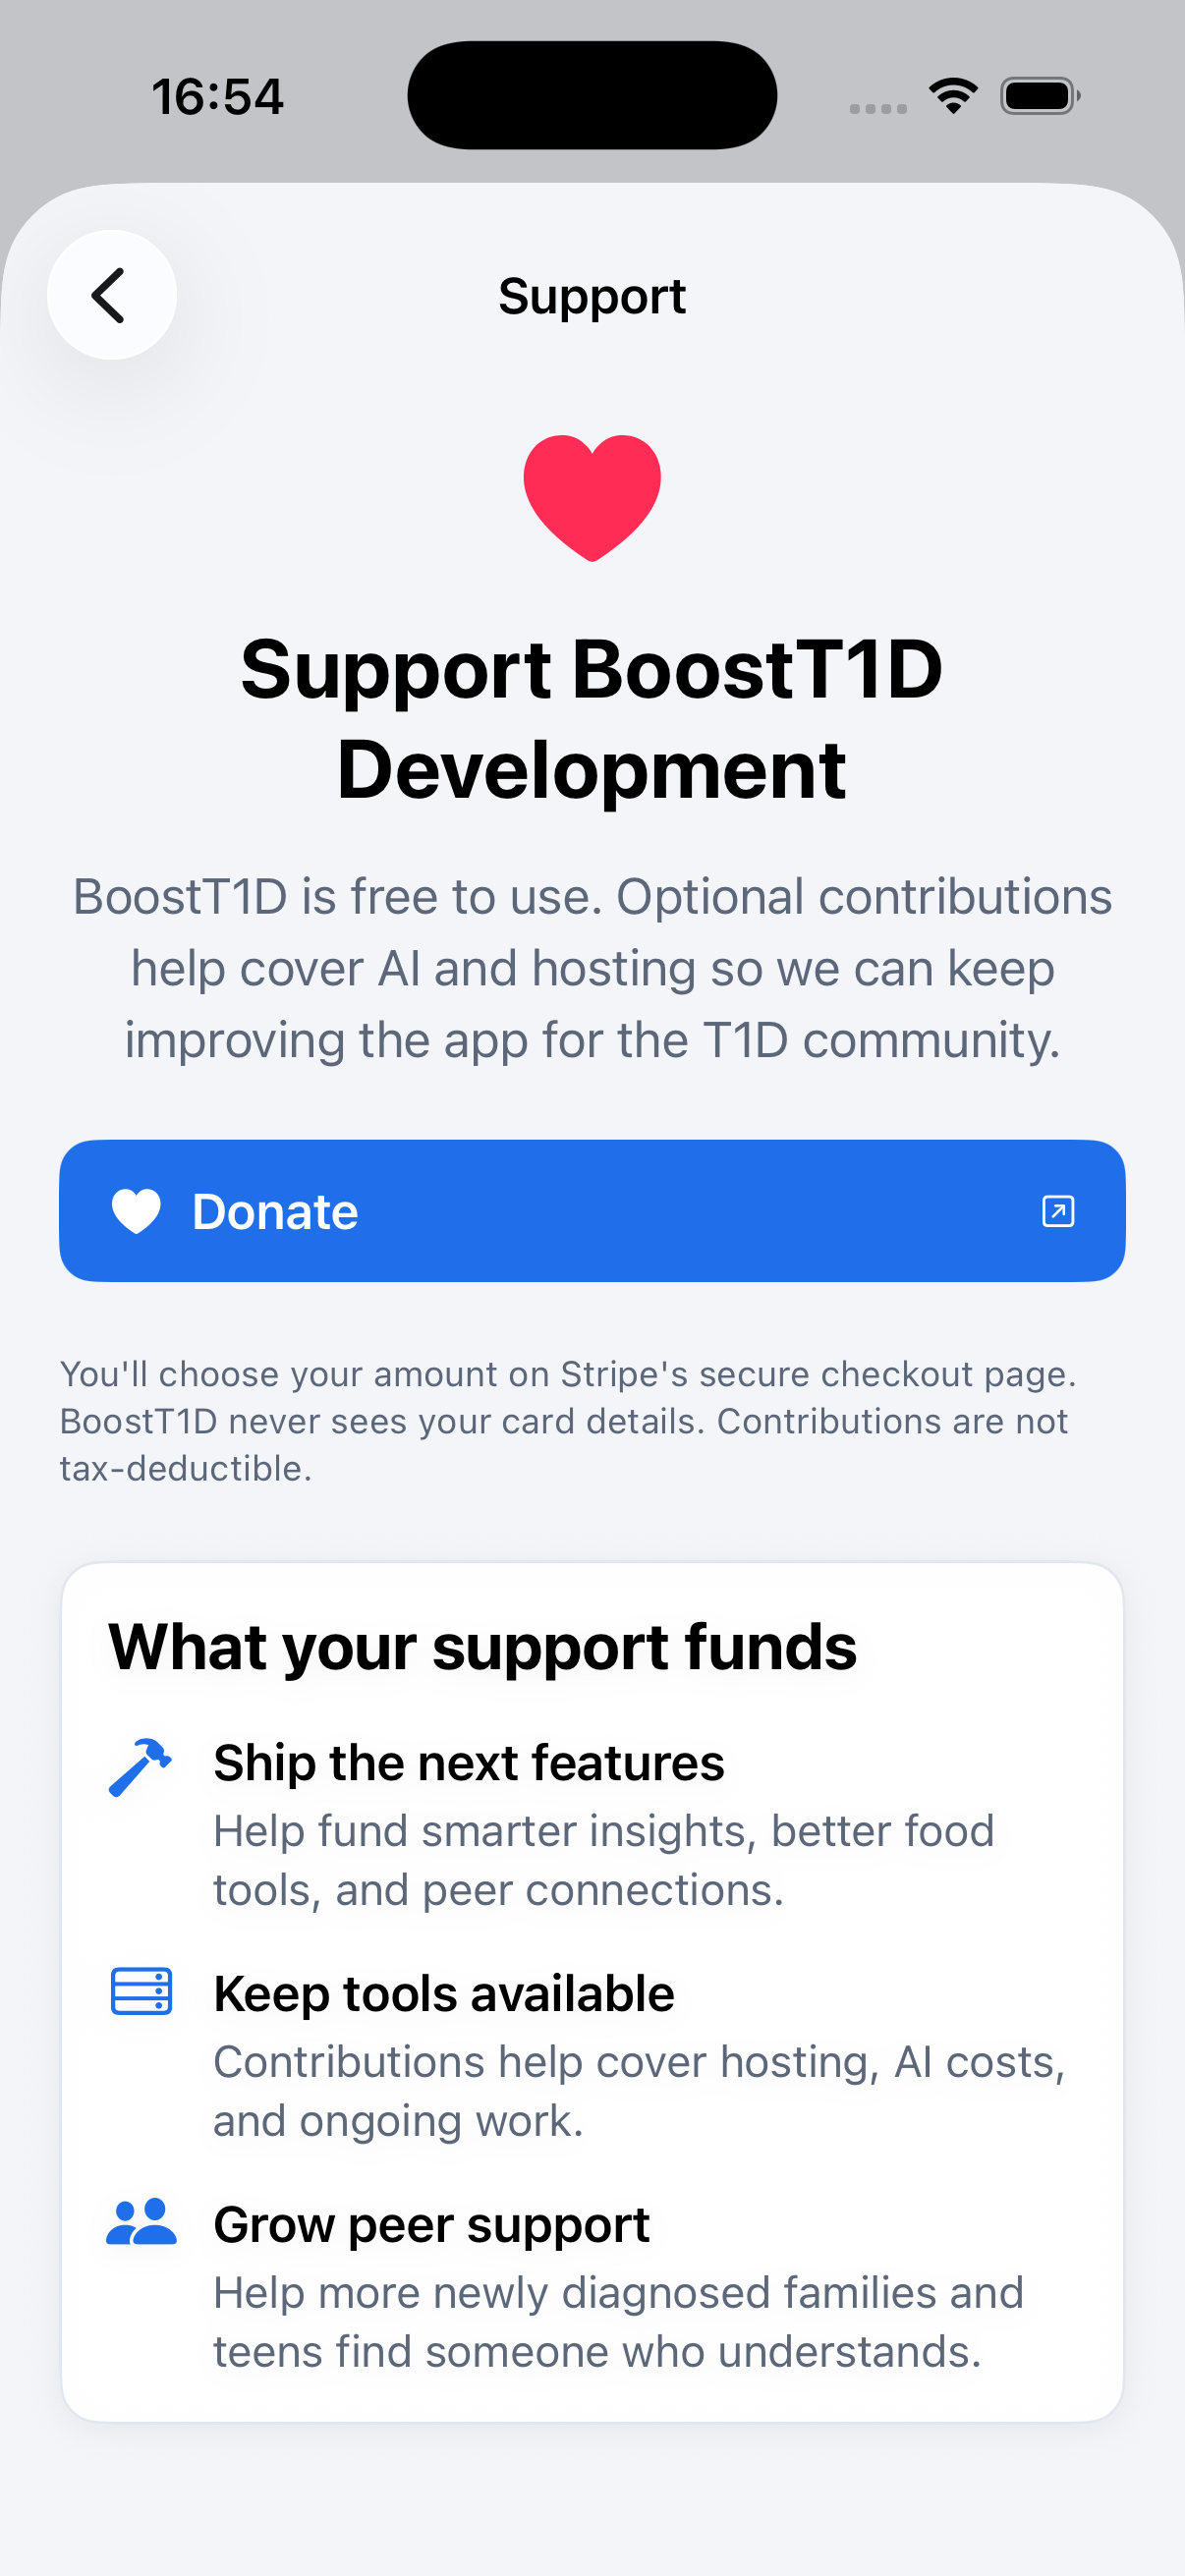
BoostT1D is free to use. Optional, non-tax-deductible contributions via Stripe's secure checkout help cover AI and hosting costs — found under All Tools → About → Support Us.