
BoostT1D for Android: User Manual
Updated September 2026
Updated September 2026
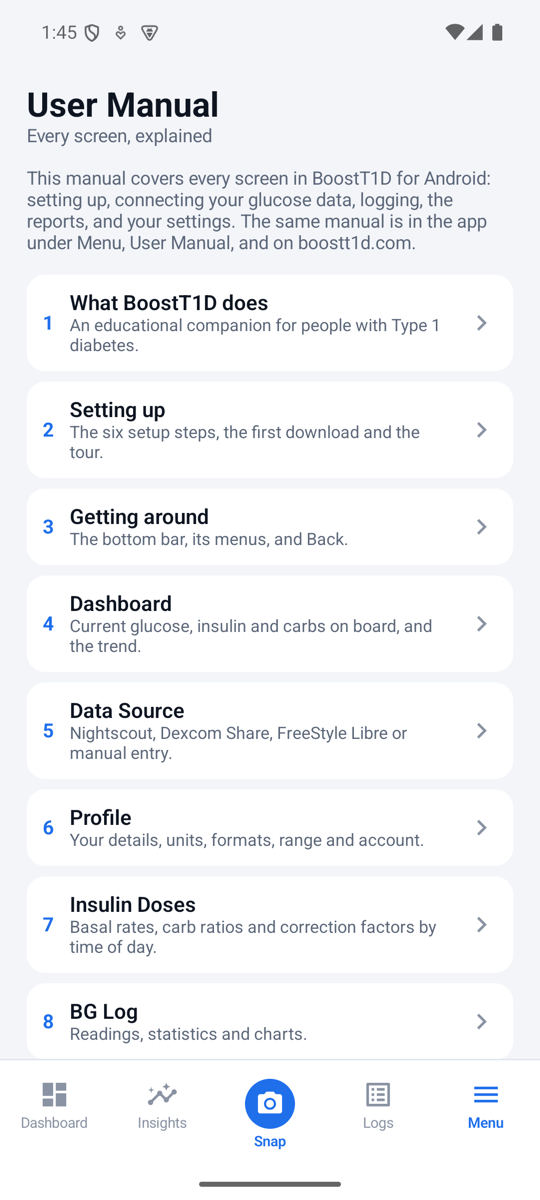
This manual covers every screen in BoostT1D for Android: setting up, connecting your glucose data, logging, the reports, and your settings. The same manual is in the app under Menu, User Manual, and on boostt1d.com. Using an iPhone? Read the iPhone manual.
Chapter 1
An educational companion for people with Type 1 diabetes.
BoostT1D puts your glucose readings, meals and insulin in one place and turns a week of that data into plain-language summaries you can use yourself and take to your care team.
Chapter 2
The six setup steps, the first download and the tour.
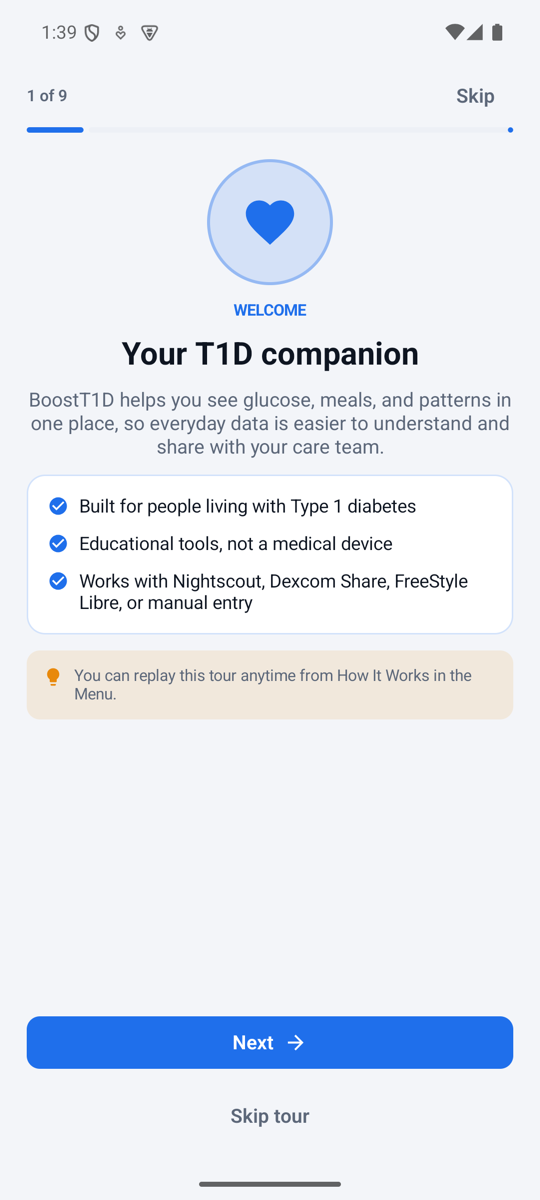
The first time you open BoostT1D a welcome screen says what the app does and that it is not a medical device. Get Started walks you through six steps. Back (the button or the system Back gesture) goes to the previous step, and nothing is saved until the last one. Leaving setup with something already typed asks first.
With a live data source, setup ends on a download screen that pulls up to 14 days of history and shows each part (readings, events, insulin doses) as it finishes. The How It Works tour then opens once. You can replay it any time from Menu.
If you leave the Connection step without a successful Test connection, the app asks whether to continue without testing. With a live data source it then asks to send notifications, which it uses to warn you before readings are lost; you can say no.
Chapter 3
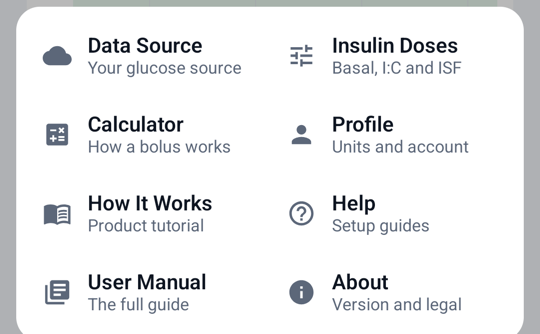
The bottom bar, its menus, and Back.
The bar at the bottom of the screen has five places:
Tapping Insights, Logs or Menu opens its menu above the bar. Tap the same button again, tap outside, or press Back to close it. Back from any other screen returns to the Dashboard; Back on the Dashboard leaves the app.
Chapter 4
Current glucose, insulin and carbs on board, and the trend.
The glucose card shows your latest reading in large type with a status badge (Very low, Low, In range, Above range, Very high), the trend arrow, and a bar from low to high with your targets printed under it. The line under the bar names the source, the change since the previous reading, and how old the reading is. The refresh button syncs now, and so does pulling the screen down.
After 15 minutes without a new reading the card turns grey, the arrow and change are hidden, and it says how long it has been. After an hour the number is replaced by --, with the last value in small type. Readings older than 6 hours are not shown as current at all. The header says when the app last synced and how old the reading is.
Below 54 mg/dL (3.0 mmol/L) a reading is marked Very low with its own color and a warning icon, and the statistics show how much time was spent there.
Active Insulin and Active Carbs come from your loop through Nightscout. BoostT1D does not estimate them. They show -- when there is no Nightscout site, when your loop has not published them, or when your last reading is more than 15 minutes old; a short line under them says which.
Pick 2h, 6h, 12h or 24h for the chart. The shaded band is your target range and the dashed lines are its edges. Below the chart are the last 24 hours: average, standard deviation, variability (CV), and time in range, low and high. History opens the BG Log.
Add event under the card logs insulin, carbs or anything else. In manual mode there are Add reading and Add event buttons instead. When a sync you started finishes, the header says Synced or Sync failed for a few seconds; if it failed, a red card says why. Tap it to retry or, for a rejected password or token, to open Data Source.
Chapter 5
Nightscout, Dexcom Share, FreeStyle Libre or manual entry.
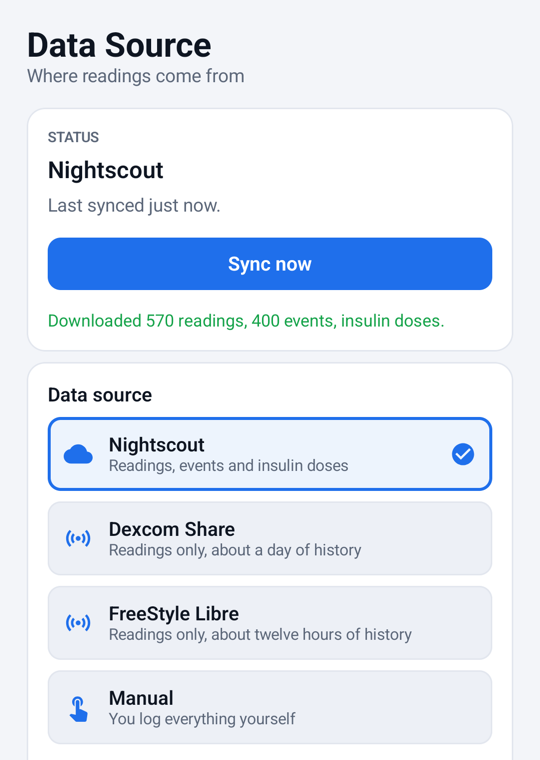
Menu, Data Source shows the current source, when it last synced, a Sync now button and what the last sync brought in. Below that you can change the source.
Save and sync stays off until the fields your source needs are filled in, and the reason is shown under the button. Saving a connection you have not tested asks first. Pressing Back with unsaved changes asks before discarding them.
Enter your site's address and an access token. Create a read-only token in Nightscout under Admin Tools; with it BoostT1D can read readings, events, insulin doses and insulin and carbs on board. Without a token you get readings only, if your site allows that. BoostT1D only reads from Nightscout and never writes to it.
Use the username (email, phone number or account ID) and password you sign in to the Dexcom app with, and pick your region: US, Outside US or Japan. The wrong region is the most common reason sign-in fails. Share must be switched on in the Dexcom app. Dexcom keeps about 24 hours of readings and sends glucose only.
BoostT1D reads Libre through LibreLinkUp, Abbott's sharing app. In the FreeStyle Libre app, invite an email address under Connected Apps, LibreLinkUp; accept the invitation in the LibreLinkUp app; then enter that LibreLinkUp account here. How do I set this up? on the screen walks through it. LibreLinkUp keeps about 12 hours and sends glucose only.
If your loop or uploader also writes to a Nightscout site, switch on Also read events from Nightscout and enter that site. Glucose then comes from Dexcom or Libre, and insulin, carbs and on-board figures from Nightscout.
Nothing is downloaded. Enter readings on the BG Log or Dashboard and events on the Event Log.
When you change source the app asks whether the new account belongs to the same person. Yes keeps your stored history. No, different person deletes the readings, events and meals on this phone and disconnects the old account, so two people's data never mix. The new source then downloads its history.
While the app is open it syncs every five minutes. In the background, Android lets it sync about every 15 minutes, but the phone may delay that. Because Dexcom and Libre only keep 24 and 12 hours, BoostT1D reminds you when a sync has not happened for three quarters of that time. Allow notifications and, if your phone is strict about battery, turn off battery optimization for BoostT1D; the card on this screen has buttons for both. If a password or token is rejected you get a notification right away, and tapping it opens this screen.
Chapter 6
Your details, units, formats, range and account.
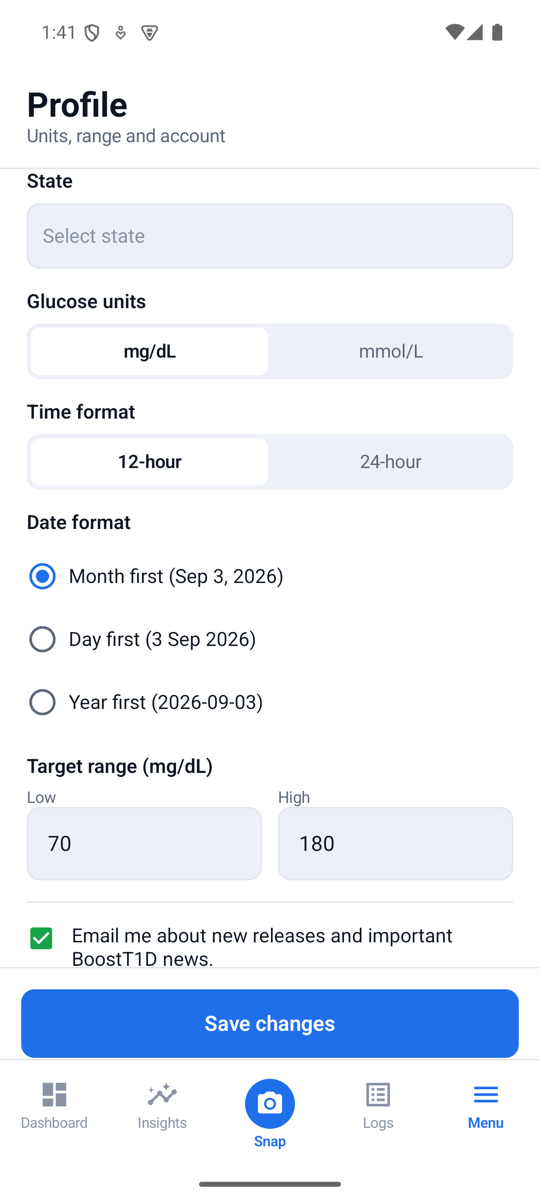
Menu, Profile holds everything from setup: name, photo, age, gender, email, parent or guardian (under 13), years with diabetes, insulin therapy, country and state, glucose units, time format, date format, and your low and high glucose targets. The targets set time in range and the colored band on every chart. Tap Save changes; pressing Back with unsaved edits asks before discarding them.
Decimal numbers can be typed with a comma or a point, so 5,4 and 5.4 both work.
Off by default, so What Happened? reads in plain English. Turn it on to also see clinical setting names, how many days each finding is based on, and the full calculation. Safety notes are shown either way.
Erases everything on the phone: profile, settings, passwords and tokens, readings, events, meals and photos, report history and exported PDFs, and tells boostt1d.com the registration was deleted. The app returns to setup. This cannot be undone.
Chapter 7
Basal rates, carb ratios and correction factors by time of day.
Menu, Insulin Doses lists your basal rates (U/hr), carb ratios (g/U) and correction factors, each by time of day, plus your duration of insulin action. Tap + to add a time slot and pick its start time from a list in 30-minute steps, tap a row to change it, or tap the trash button, which asks before removing it. Enter the numbers exactly as your care team set them. They feed the calculator and the therapy review.
An unusual value, such as a basal rate over 5 U/hr, a carb ratio outside 2 to 100 g/U or a correction factor outside 5 to 400 mg/dL per unit, shows a warning and asks you to confirm with Save anyway.
The card at the top says where the doses came from:
Chapter 8
Readings, statistics and charts.
Logs, BG Log starts with your latest reading and its change, then statistics for the window you pick (1, 3 or 7 days): estimated A1C (shown once there are about 14 days of data), average, standard deviation, CV and time in range, with the very-high share (above 250 mg/dL) and the very-low share (below 54 mg/dL) broken out.
The chart is a line for one day. For longer windows it becomes an ambulatory glucose profile (AGP): the median across days with the middle 50% and 90% of readings shaded, so a typical day shows through. Switch to Raw Data to see every reading grouped by day with its trend arrow.
Add a reading lets you enter a fingerstick with any date and time in the last 14 days. Only readings you entered can be edited or deleted; tap one to edit it. Downloaded readings come back from the source on the next sync. Your window and tab choices are kept while the app is open.
Chapter 9
Insulin, carbs, temp basals and other events.
Logs, Event Log is one timeline of boluses, temp basals, carbs, exercise, site changes, notes and profile switches, grouped by day with totals. Pick a window, then use the type chips (with Select all and Clear all) to filter. Temp basals show their rate and length, for example 0.8U/hr for 30min.
Tap Log an event to add one with its type, time (any time in the last 30 days), insulin, carbs, duration and a note. Only the fields the chosen type shows are saved, so switching a dose to a note does not keep the insulin you typed. Tap an event you added to edit it. Downloaded carb entries live in the Food Log instead, so they are not counted twice.
Chapter 10
A carb estimate from a photo.
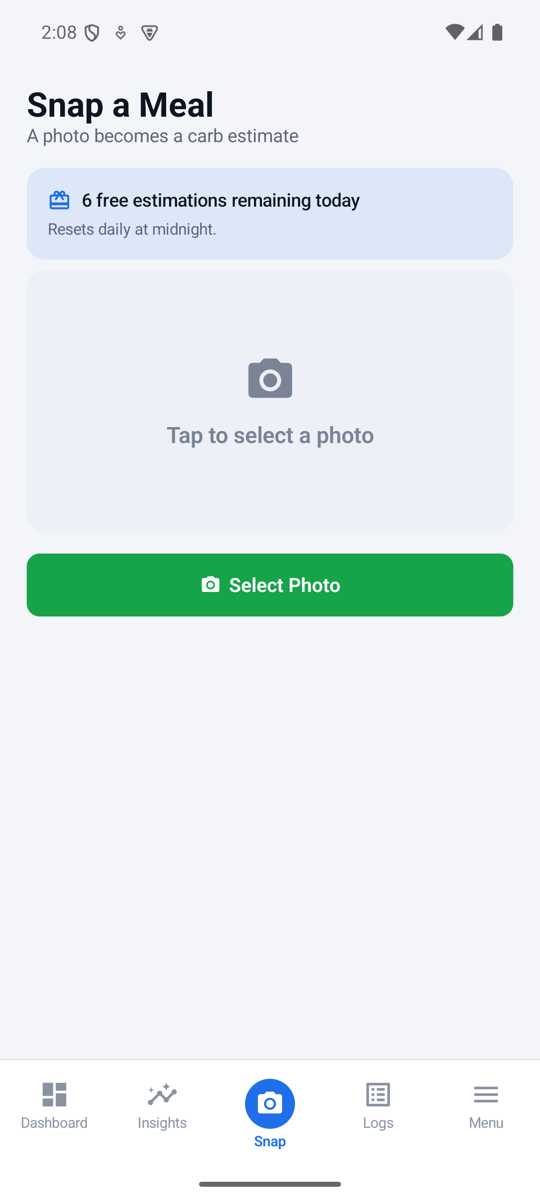
You get six free estimates a day; the count resets at midnight. A failed attempt does not use one, and Try again runs the same photo again. When none are left, Log it by hand instead opens the meal editor with your photo attached. Picking a new photo before saving the current estimate asks first. The photo is not stored on the server.
Chapter 11
Saved meals and carbs from your event log.
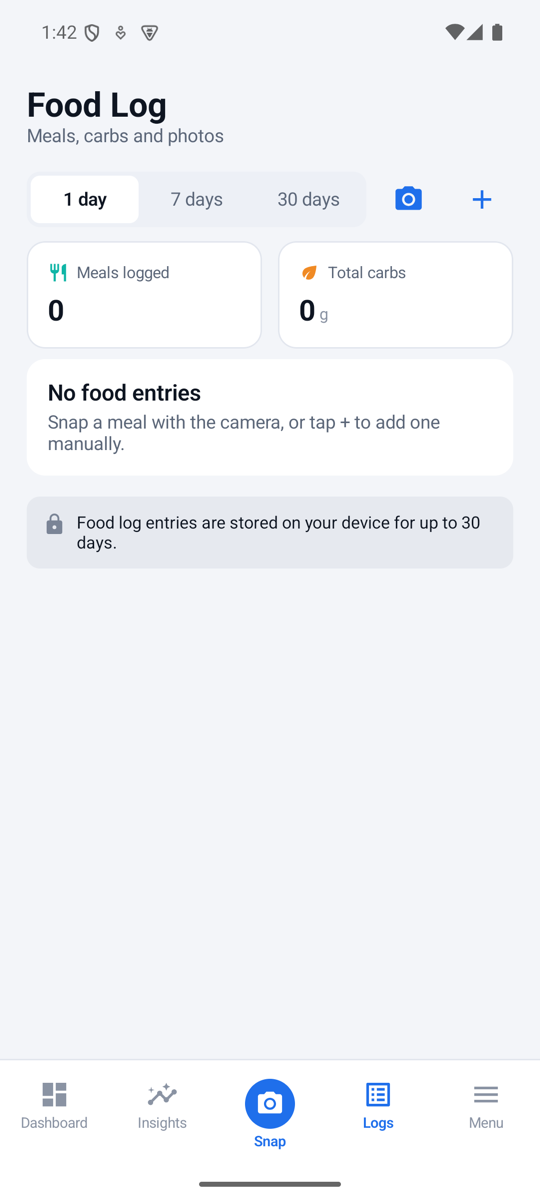
Logs, Food Log lists meals over 1, 7 or 30 days with totals. It holds photo estimates you saved, meals you typed in, and carb entries from your event log, which are added automatically. Fat and protein show when your loop or uploader records them.
Tap + to add a meal by hand (the camera button opens Snap a Meal), with a photo from the camera or library, carbs and other nutrients, insulin given, and any date and time up to now. Tap a meal to edit or delete it.
Chapter 12
How a bolus is worked out, shown step by step.
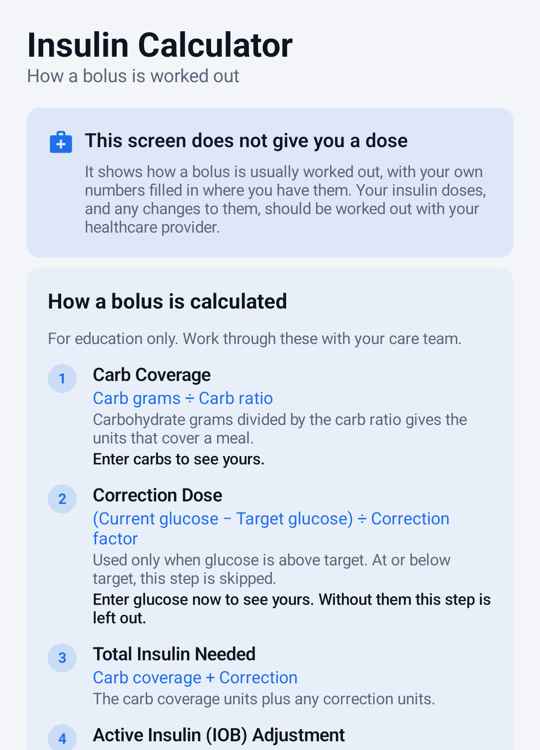
Menu, Calculator (or Calculator from a meal estimate) explains how a bolus is worked out. This version does not give you a dose; the screen says so at the top.
It walks through each step of the standard formula (carb coverage, correction, total, active insulin) with your own numbers written in where they are known: carbs, current glucose, and the target, carb ratio and correction factor from Insulin Doses for the current time. You can change any of them. If insulin on board is left blank it is treated as unknown and that step is left out, never counted as zero.
A field that cannot be read shows an error instead of being ignored. Work out your actual doses with your care team.
Chapter 13
Your last seven days in four pages.
Insights, What Happened? opens on the last report straight away and refreshes underneath. Swipe or tap between its four pages. If a refresh fails, a card says so with Try again, and the last report stays on screen.
Time in range, low, high and very high against the week before, GMI, and a short account of how the week went.
The strongest repeated patterns of the week, such as morning highs or lows after corrections, each with a day-by-day chart, possible factors and a question for your care team. Below them, food, exercise and timing context that may explain them.
Whether your basal rate, carb ratio or correction factor may have played a part. A note at the top says these are things to discuss, not dosing instructions. Your insulin settings lists anything worth raising; tap one for the current value and a value To discuss with your care team, why it came up, how strong the evidence is, and a question to bring. A suggestion never moves more than half the gap to what the data showed, or more than 20% in one review. Your changes shows, for each setting change the app has seen, whether it helped: Improved, Worse, Unchanged, Too early or Not enough data yet.
The numbers always come from a fixed formula. Once a day an AI pass may add wording on top; it never changes the numbers.
Each day with its average, time in range, meals, boluses, lows and total daily dose (TDD), which includes basal when it can be worked out and otherwise shows bolus only. Today only counts up to now.
Chapter 14
A report for your appointment, on screen and as a PDF.
Insights, Doctor Visit builds a report over 7 or 14 days (Report period), in three pages (Page), which you can also swipe between:
The share button makes a PDF and opens Android's share sheet. The ⋮ menu next to it prints the report or saves the PDF to a folder you choose. Only the newest PDF is kept on the phone. The comparison with the period before needs history the app does not keep for the 14-day report, so that section says so instead.
Chapter 15
The tour, setup guides and app details.
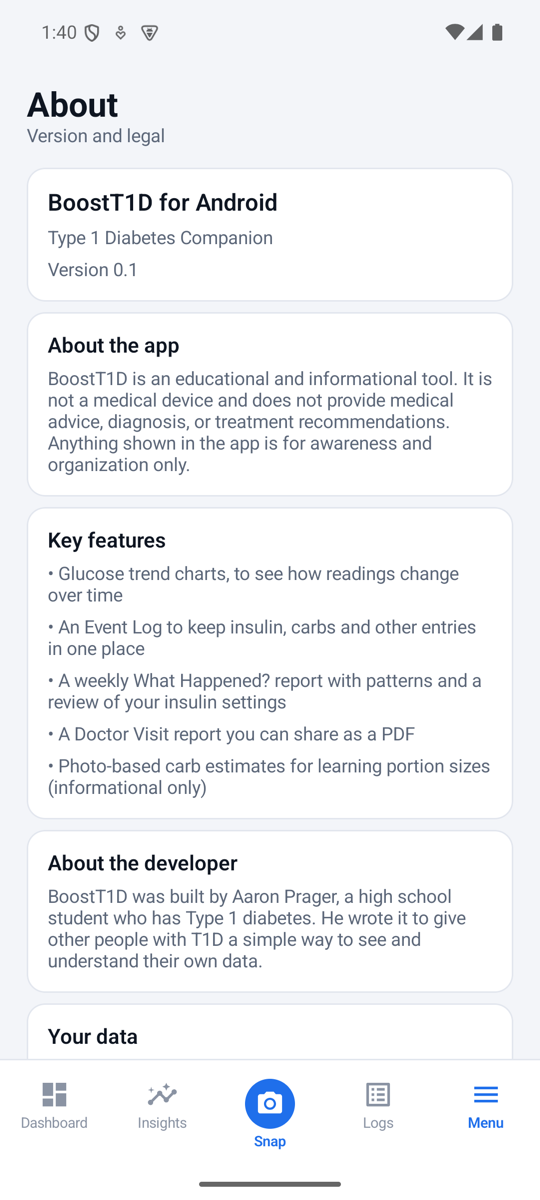
Chapter 16
What stays on the phone and what leaves it.
Chapter 17
Common problems and what to do.
Copy the token again from Admin Tools, including the part before the dash. If you pasted your API secret instead, that also works, but a read-only token is safer.
Check the region first. Make sure Share is on in the Dexcom app and that at least one follower exists. After several failed tries Dexcom locks sign-in for a while; wait before trying again.
Open the LibreLinkUp app, accept the new terms there, then tap Sync now. BoostT1D cannot accept them for you.
They need Nightscout and a loop that publishes them, and they hide when your last reading is over 15 minutes old. The line under them says which applies.
Allow notifications and turn off battery optimization for BoostT1D on Data Source. Some phones also need BoostT1D allowed to run in the background in their own battery settings.
Change the time format and date format in Profile. Month and day names are always in English, to match the rest of the app.